
















©The Author(s) 2025.
World J Diabetes. Oct 15, 2025; 16(10): 111548
Published online Oct 15, 2025. doi: 10.4239/wjd.v16.i10.111548
Published online Oct 15, 2025. doi: 10.4239/wjd.v16.i10.111548
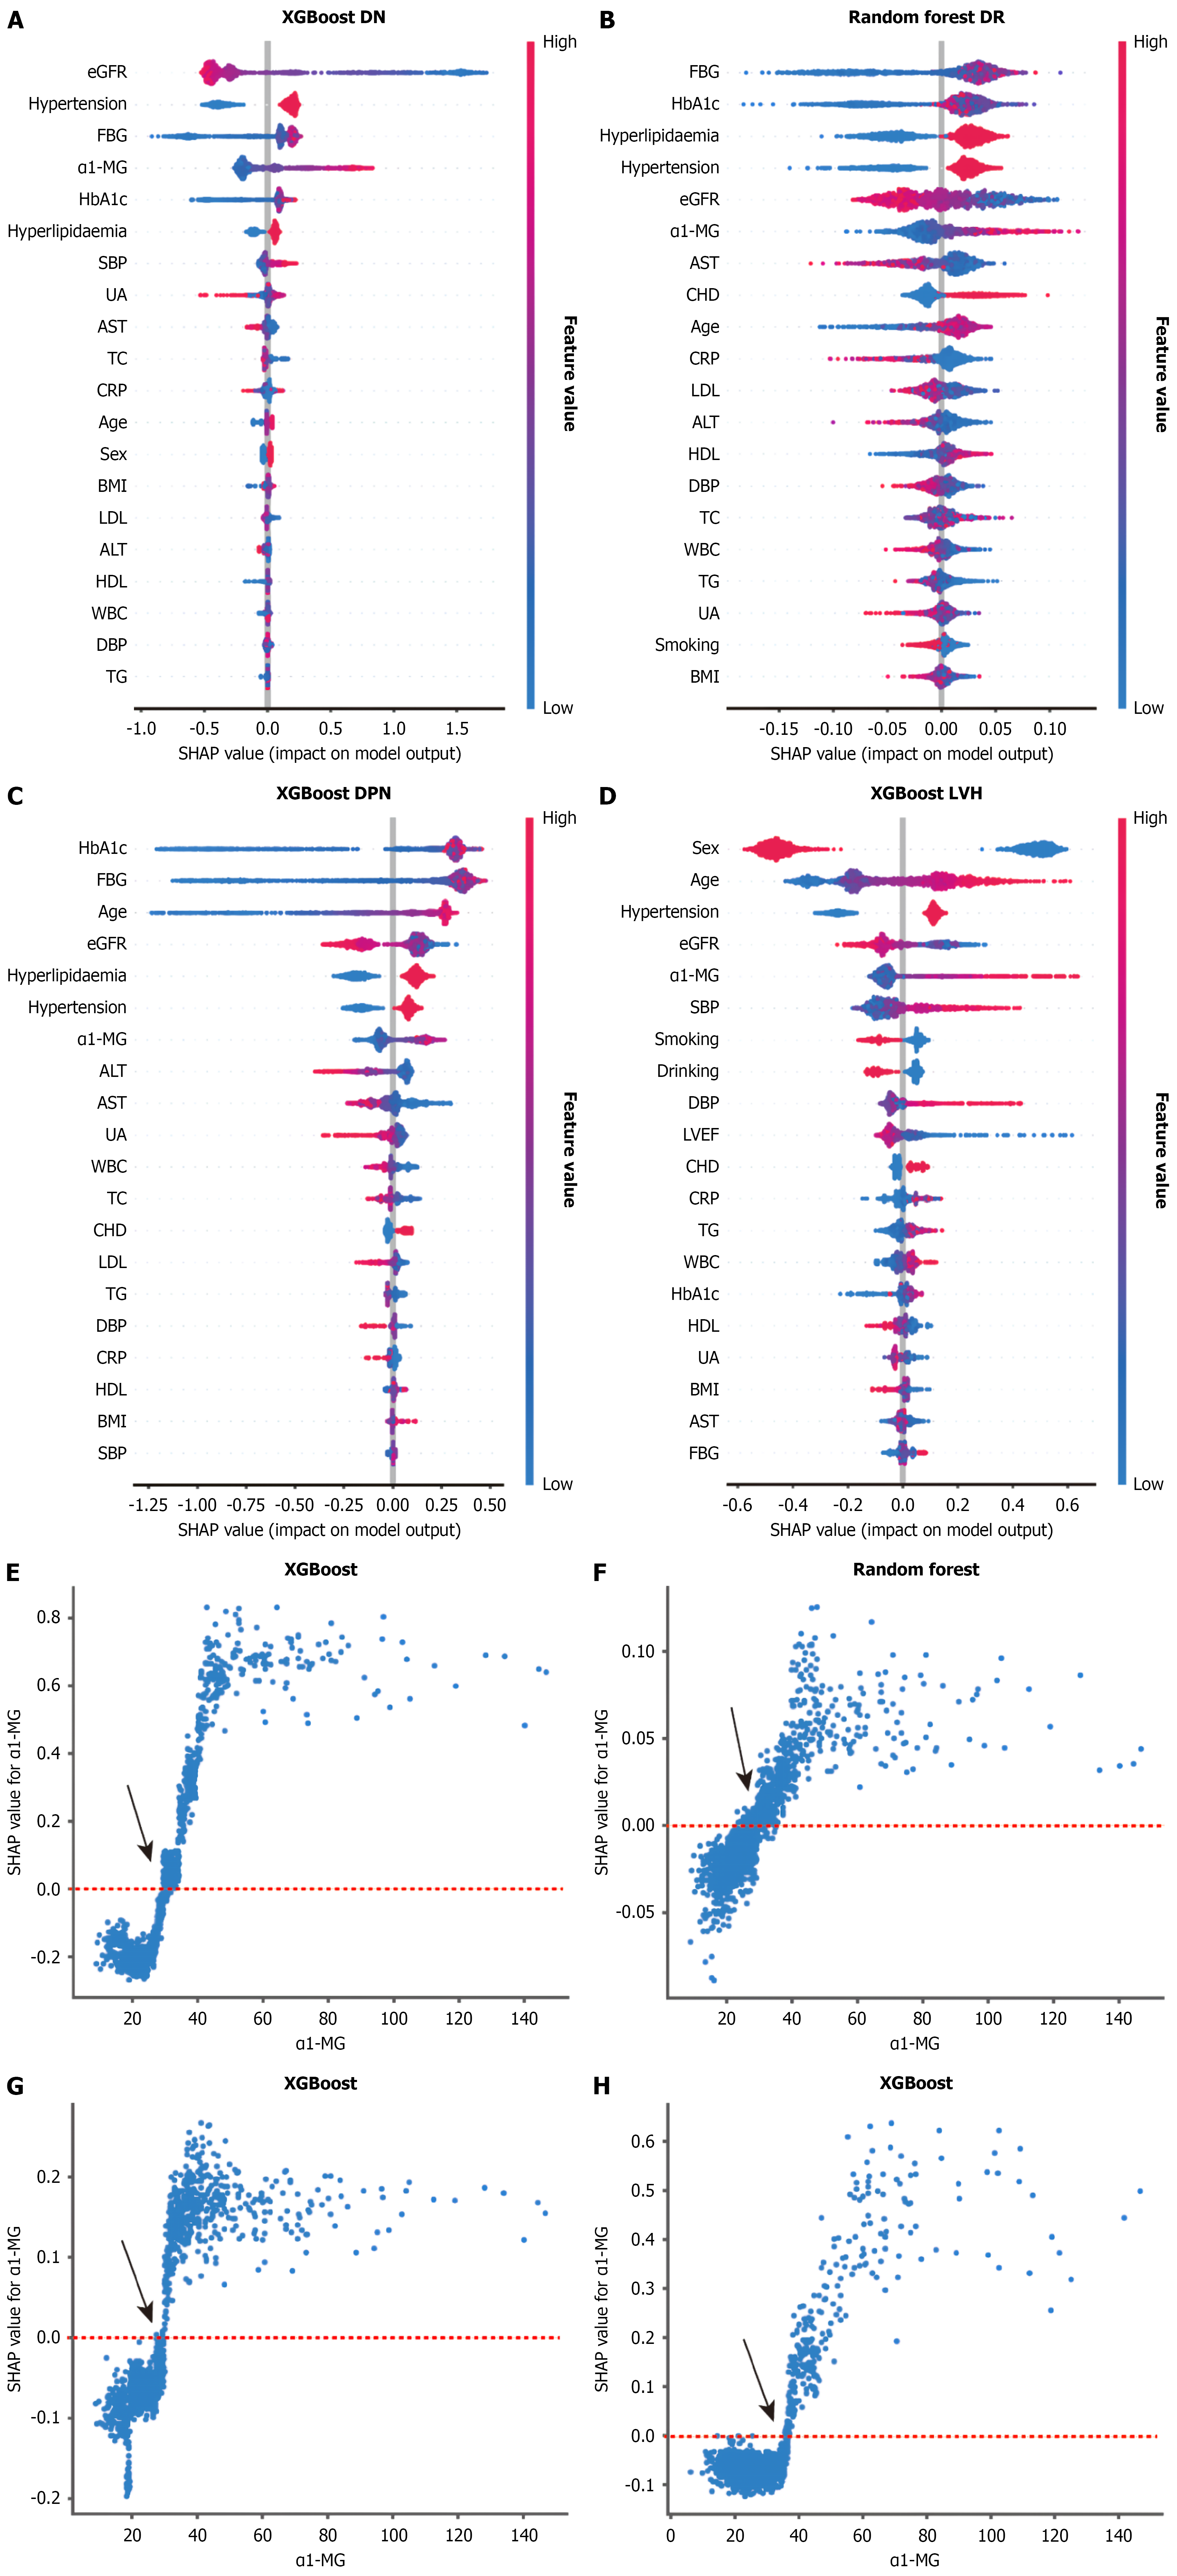
Figure 3 Associations of serum alpha-1-microglobulin with the risk of diabetic complications revealed by SHapley Additive exPlanations summary and dependence plots.
A: SHapley Additive exPlanations (SHAP) summary plot for diabetic nephropathy (DN); B: SHAP summary plot for diabetic retinopathy (DR); C: SHAP summary plot for diabetic peripheral neuropathy (DPN); D: SHAP summary plot for Left ventricular hypertrophy (LVH); E: SHAP dependence plot for DN; F: SHAP dependence plot for DR; G: SHAP dependence plot for DPN; H: SHAP dependence plot for LVH. In Figure 3A-D, each dot represents a patient, and the X-axis shows the SHAP value of the corresponding feature. For continuous variables, dot color indicates feature values, ranging from blue (low) to red (high). For categorical variables, blue denotes female sex or positive status, and red denotes male sex or negative status. In Figure 3E-H, the red dashed line represents SHAP = 0, and black arrows indicate threshold points. When the SHAP value of alpha-1-microglobulin exceeds zero, it indicates an increased risk of DN, DR, DPN, and LVH. XGBoost: Extreme gradient boosting; SHAP: SHapley Additive exPlanations; DN: Diabetic nephropathy; DR: Diabetic retinopathy; DPN: Diabetic peripheral neuropathy; LVH: Left ventricular hypertrophy; α1-MG: Alpha-1-microglobulin.
- Citation: Ge LC, Zhang YL, Peng GL, Long M, Jin T, Lu B, Shao JQ, Li X. Serum alpha-1-microglobulin as a predictor of multiple complications in type 2 diabetes mellitus patients. World J Diabetes 2025; 16(10): 111548
- URL: https://www.wjgnet.com/1948-9358/full/v16/i10/111548.htm
- DOI: https://dx.doi.org/10.4239/wjd.v16.i10.111548