Copyright
©The Author(s) 2023.
World J Diabetes. Jul 15, 2023; 14(7): 1077-1090
Published online Jul 15, 2023. doi: 10.4239/wjd.v14.i7.1077
Published online Jul 15, 2023. doi: 10.4239/wjd.v14.i7.1077
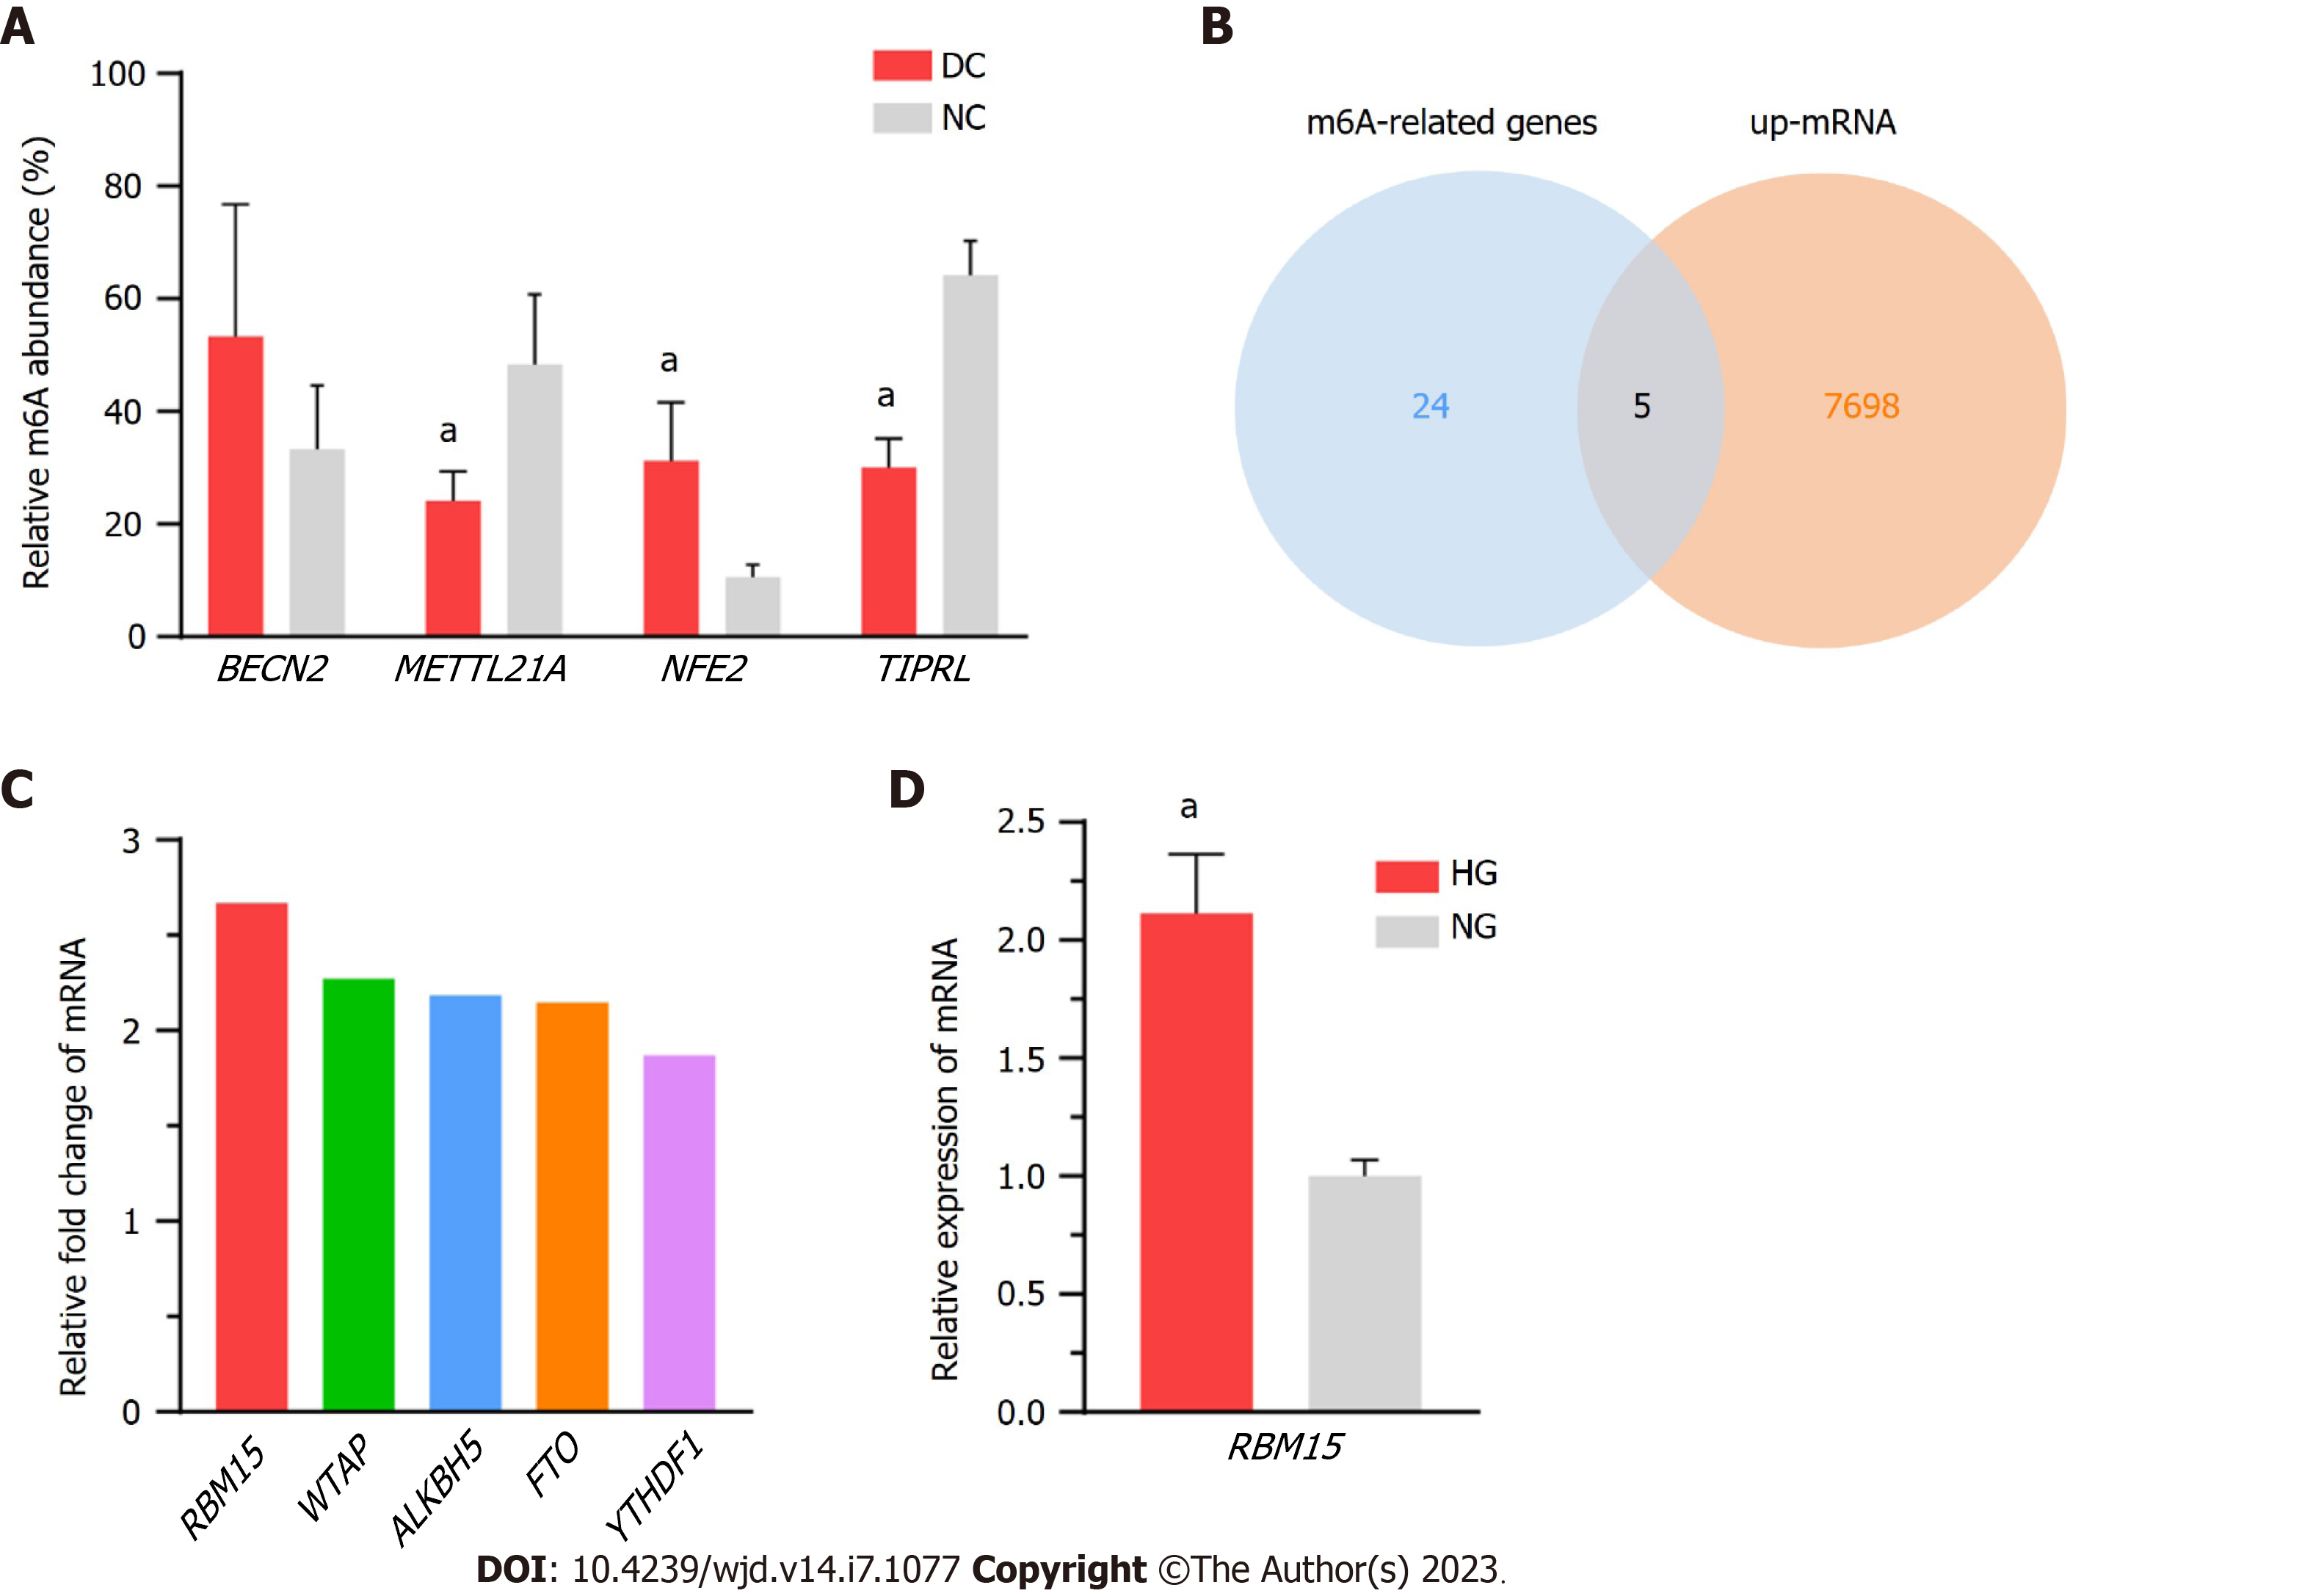
Figure 7 Validation of the diverse expression levels of methylated mRNA and RNA methyltransferase, using in vivo and in vitro models.
A: Methylation levels of BECN2, METTL21A, NFE2, and TIPRL are consistent with the microarray data for the diabetic cataract and normal control groups; B: Intersection results of upregulated mRNAs and N6-methyladenosine-related genes; C: Fold change values of five genes (RBM15, WTAP, ALKBH5, FTO, and YTHDF1) in microarray results; D: The mRNA levels of RBM15 are significantly higher in high-glucose cultured SRA01/04 cells than in normal-glucose cultured ones. DC: Diabetic cataract; NC: Normal control; HG: High-glucose; NG: Normal-glucose. aP < 0.05.
- Citation: Cai L, Han XY, Li D, Ma DM, Shi YM, Lu Y, Yang J. Analysis of N6-methyladenosine-modified mRNAs in diabetic cataract. World J Diabetes 2023; 14(7): 1077-1090
- URL: https://www.wjgnet.com/1948-9358/full/v14/i7/1077.htm
- DOI: https://dx.doi.org/10.4239/wjd.v14.i7.1077


