Copyright
©The Author(s) 2022.
World J Diabetes. Jul 15, 2022; 13(7): 532-542
Published online Jul 15, 2022. doi: 10.4239/wjd.v13.i7.532
Published online Jul 15, 2022. doi: 10.4239/wjd.v13.i7.532
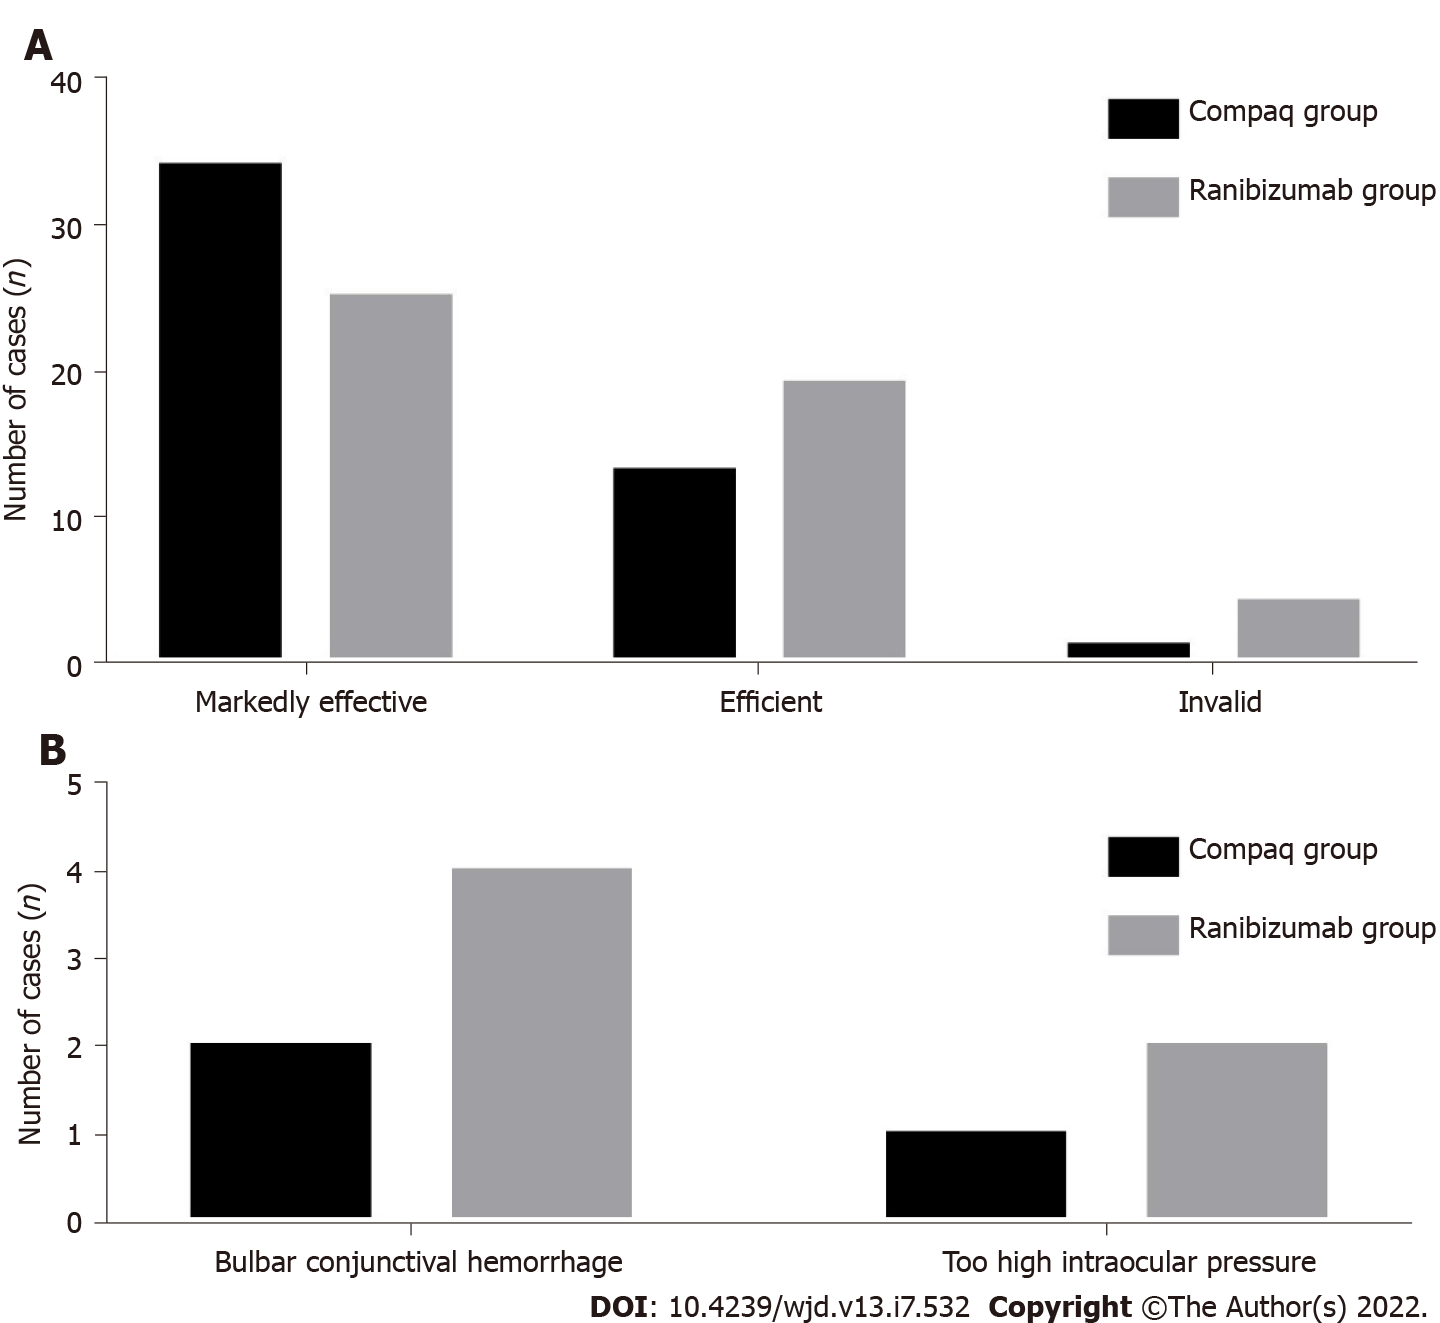
Figure 1 Histogram of clinical efficiency and incidence of adverse reaction between the two groups.
A: Histogram of clinical efficiency; B: Incidence of adverse reaction.
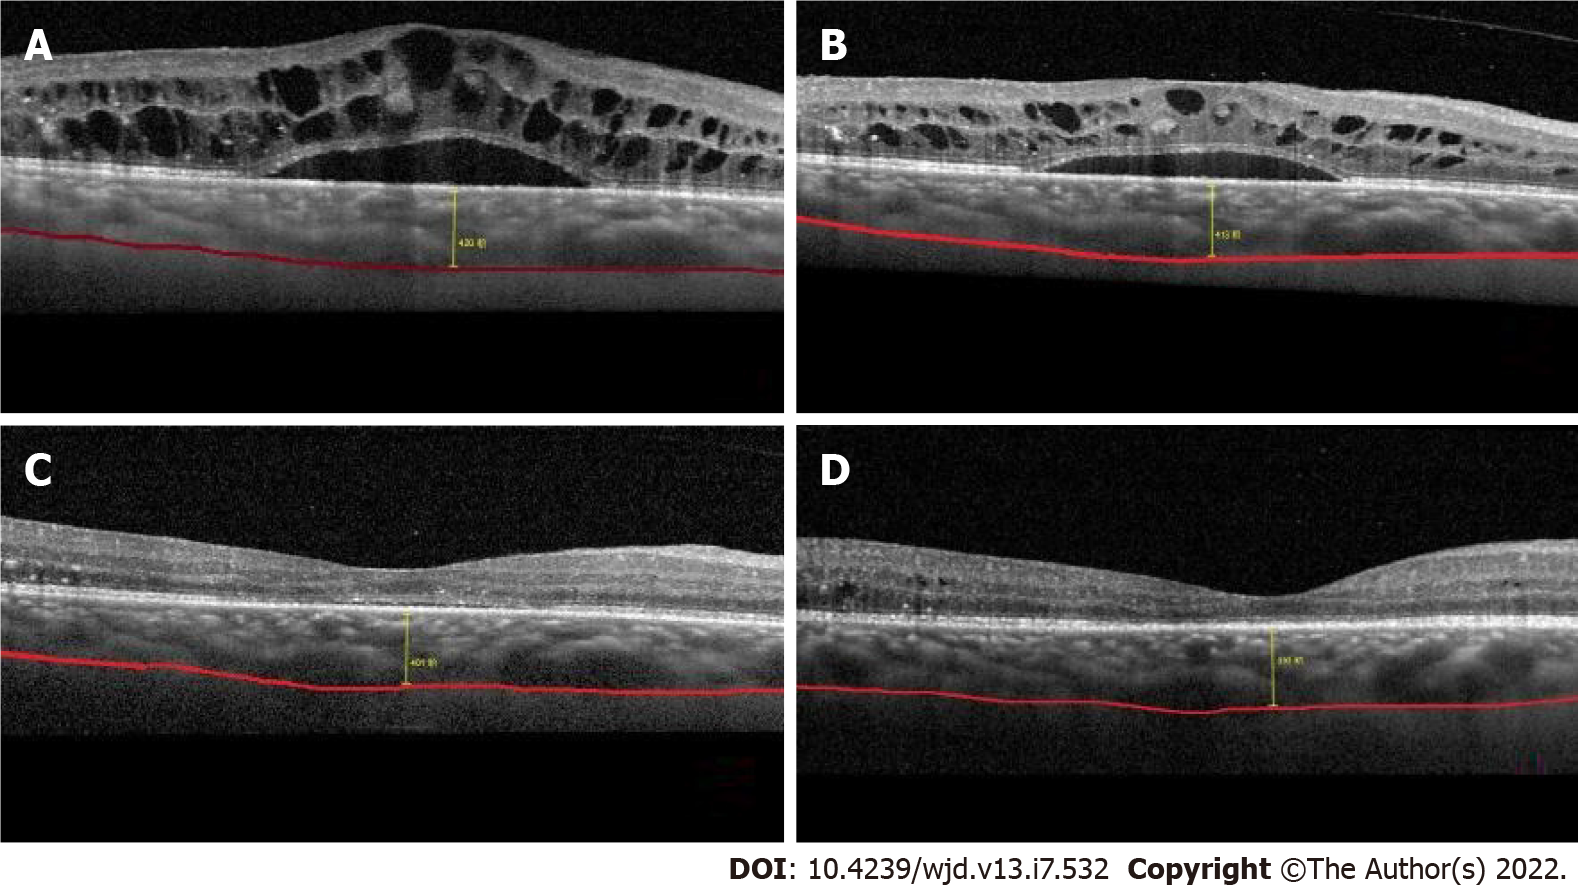
Figure 2 The optical coherence tomography test results of before and after patient treatment.
A: The test result of optical coherence tomography before the treatment, where macular edema was obvious; B: Re-examination after 1 wk of treatment, where the macular edema is slightly relieved; C: Re-examination after 1 month of treatment, where the macular edema was significantly reduced; D: The condition of the patient 3 mo post-treatment, where the macular edema has nearly disappeared, and the choroid thickness has become significantly thinner.
- Citation: Li YF, Ren Q, Sun CH, Li L, Lian HD, Sun RX, Su X, Yu H. Efficacy and mechanism of anti-vascular endothelial growth factor drugs for diabetic macular edema patients. World J Diabetes 2022; 13(7): 532-542
- URL: https://www.wjgnet.com/1948-9358/full/v13/i7/532.htm
- DOI: https://dx.doi.org/10.4239/wjd.v13.i7.532


