Copyright
©The Author(s) 2017.
World J Gastrointest Oncol. Nov 15, 2017; 9(11): 444-451
Published online Nov 15, 2017. doi: 10.4251/wjgo.v9.i11.444
Published online Nov 15, 2017. doi: 10.4251/wjgo.v9.i11.444
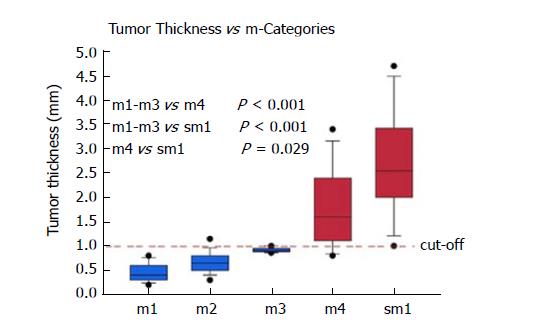
Figure 3 Box plot of the median tumour thickness in the different m-categories.
Circles = 5/95 percentiles. The dashed line indicates the proposed cut-off to discriminate between m1-3 and m4/sm1.
- Citation: Endhardt K, Märkl B, Probst A, Schaller T, Aust D. Value of histomorphometric tumour thickness and smoothelin for conventional m-classification in early oesophageal adenocarcinoma. World J Gastrointest Oncol 2017; 9(11): 444-451
- URL: https://www.wjgnet.com/1948-5204/full/v9/i11/444.htm
- DOI: https://dx.doi.org/10.4251/wjgo.v9.i11.444


