Copyright
©The Author(s) 2016.
World J Gastrointest Oncol. Nov 15, 2016; 8(11): 772-785
Published online Nov 15, 2016. doi: 10.4251/wjgo.v8.i11.772
Published online Nov 15, 2016. doi: 10.4251/wjgo.v8.i11.772
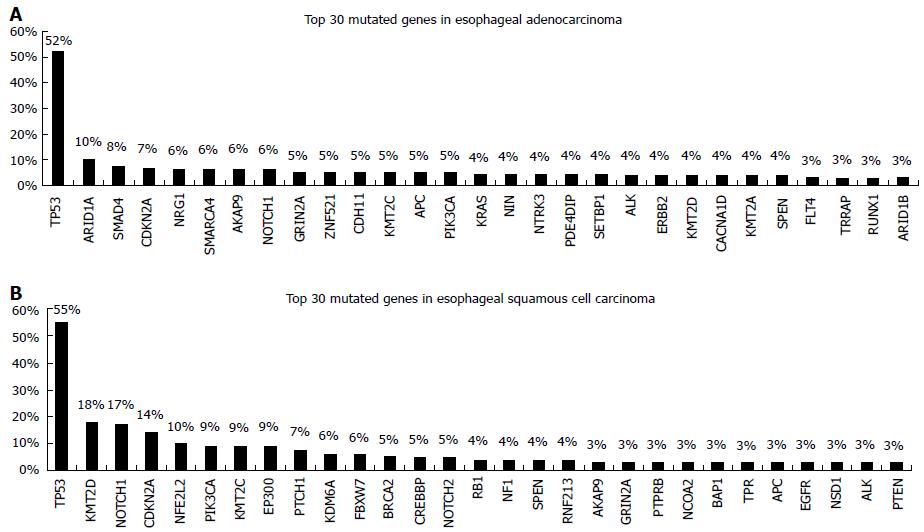
Figure 1 Bar chart showing the most frequently mutated genes in esophageal cancer according to catalogue of somatic mutations in cancer database.
In the Y-axis the percentage of observed mutation frequency is represented. In the X-axis the most frequently mutated genes are listed. A: Top 30 mutated genes in esophageal adenocarcinoma; B: Top 30 mutated genes in esophageal squamous cell carcinoma.
- Citation: Papadopoulou E, Metaxa-Mariatou V, Tsaousis G, Tsoulos N, Tsirigoti A, Efstathiadou C, Apessos A, Agiannitopoulos K, Pepe G, Bourkoula E, Nasioulas G. Molecular predictive markers in tumors of the gastrointestinal tract. World J Gastrointest Oncol 2016; 8(11): 772-785
- URL: https://www.wjgnet.com/1948-5204/full/v8/i11/772.htm
- DOI: https://dx.doi.org/10.4251/wjgo.v8.i11.772


