Copyright
©The Author(s) 2015.
World J Gastrointest Oncol. Sep 15, 2015; 7(9): 132-140
Published online Sep 15, 2015. doi: 10.4251/wjgo.v7.i9.132
Published online Sep 15, 2015. doi: 10.4251/wjgo.v7.i9.132
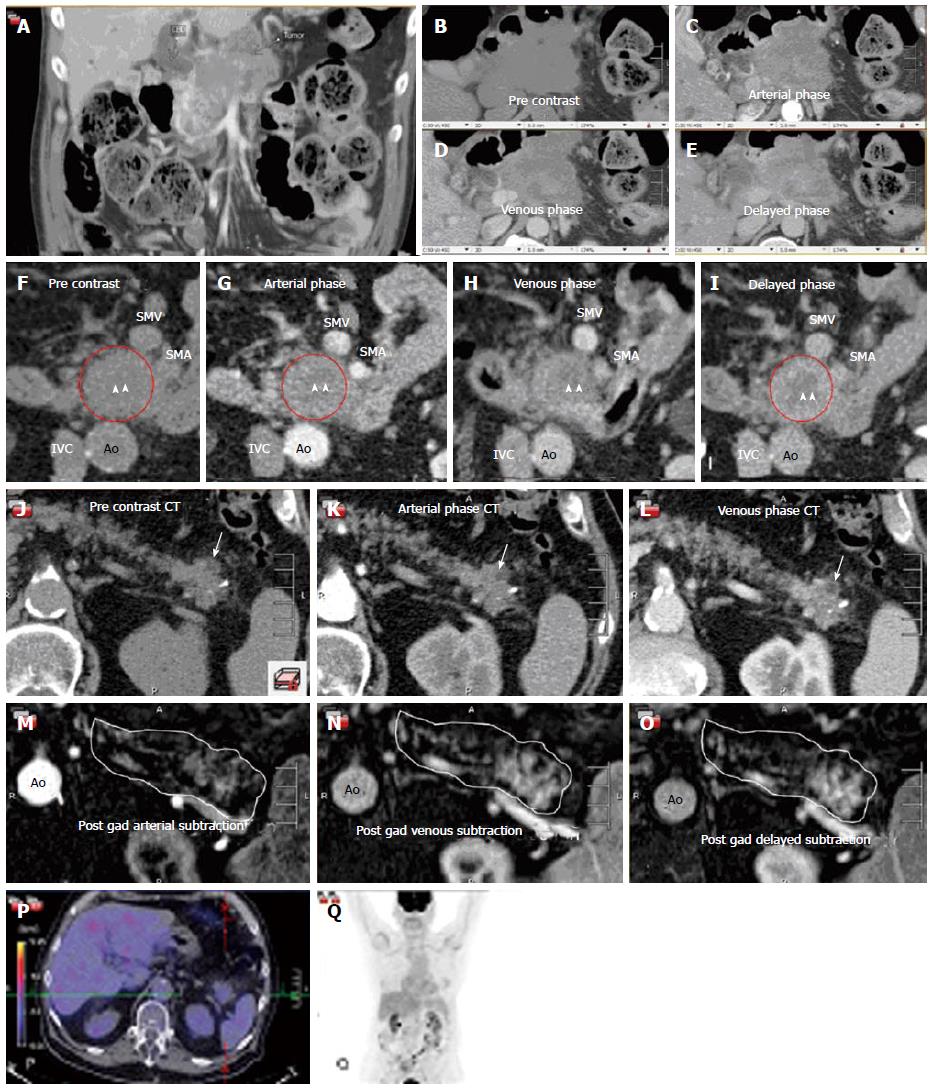
Figure 2 Collection of images from three separate patients with adenosquamous carcinoma of the pancreas.
The typical complex enhancing mass and mixed morphology of necrosis and enhancing tissue is demonstrated in this figure. A-E are taken from a four phase contrast enhanced CT (pre-contrast, arterial, venous and delayed images). This type of scanning technique can be helpful to define the tumor and its invasion into surrounding structrures. A-E represent a coronal (A) and axial (B-E) images through a large, infiltrating, necrotic tumor with islands of slow enhancement (B-E). Note the islands of soft tissue enhancement increasing from arterial to delayed phase contrast enhanced CTs. These features are usually signs of very aggressive tumors. In another subject (F-I) there is again a central area of necrosis (arrowheads) surrounded by a ring of slowly enhancing tumor (red circle). Note the relative lack of surrounding soft tissue infiltration compared to the tumor on Panels A-E. Panels J-O are taken from a third subject and are an example of an atypical adenosquamous carcinoma involving the pancreas tail with a slowly enhancing, non-infiltrating lesion both on CT (J-L) and post gadolinium subtraction MRI (M-O). The white outline in Panels M-O outlines the contour of the pancreas with the enhancing lesion seen towards the tail of the pancreas. There is a small focus of necrosis present (arrow), a feature typical of adenosquamous carcinoma of the pancreas. The corresponding FDG PET/CT (P and Q) is unusual in that it shows that this mass is not hypermetabolic unlike most adenosquamous pancreas carcinomas. Ao: Aorta; IVC: Inferior vena caval; SMA: Superior mesenteric artery; SMV: Superior mesenteric vein.
- Citation: Borazanci E, Millis SZ, Korn R, Han H, Whatcott CJ, Gatalica Z, Barrett MT, Cridebring D, Hoff DDV. Adenosquamous carcinoma of the pancreas: Molecular characterization of 23 patients along with a literature review. World J Gastrointest Oncol 2015; 7(9): 132-140
- URL: https://www.wjgnet.com/1948-5204/full/v7/i9/132.htm
- DOI: https://dx.doi.org/10.4251/wjgo.v7.i9.132


