Copyright
©2014 Baishideng Publishing Group Co.
World J Gastrointest Oncol. Jan 15, 2014; 6(1): 22-33
Published online Jan 15, 2014. doi: 10.4251/wjgo.v6.i1.22
Published online Jan 15, 2014. doi: 10.4251/wjgo.v6.i1.22
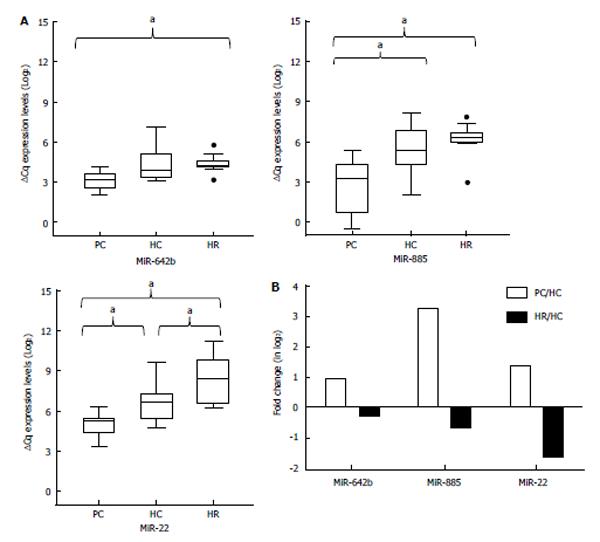
Figure 3 Validation of three-microRNA panel using quantitative real-time reverse transcription polymerase chain reaction.
A: Box plot of relative expression of three miRNAs, based on normalized mean ΔCq values [mean quantification cycle (Cq) normalized to miR-3196] of pancreatic cancer patients (PC, n = 11), healthy controls (HC, n = 11), and high risk controls (HR, n = 11). The whiskers extend to the observations which are no more than 1.5 times the length of the box (interquartile range) away from the box. More extreme observations are considered outliers and are indicated as dots. "a" indicates P value ≤ 0.017 (0.05/3, a Bonferroni-adjusted α-level based on the 3 multiple comparisons performed among patient groups); B: Fold change expression levels of three miRNAs calculated as the ratio of mean fold change of PC/HC and HR/HC. MiRNA: MicroRNA.
- Citation: Ganepola GA, Rutledge JR, Suman P, Yiengpruksawan A, Chang DH. Novel blood-based microRNA biomarker panel for early diagnosis of pancreatic cancer. World J Gastrointest Oncol 2014; 6(1): 22-33
- URL: https://www.wjgnet.com/1948-5204/full/v6/i1/22.htm
- DOI: https://dx.doi.org/10.4251/wjgo.v6.i1.22


