Copyright
©2013 Baishideng Publishing Group Co.
World J Gastrointest Oncol. Nov 15, 2012; 4(11): 216-222
Published online Nov 15, 2012. doi: 10.4251/wjgo.v4.i11.216
Published online Nov 15, 2012. doi: 10.4251/wjgo.v4.i11.216
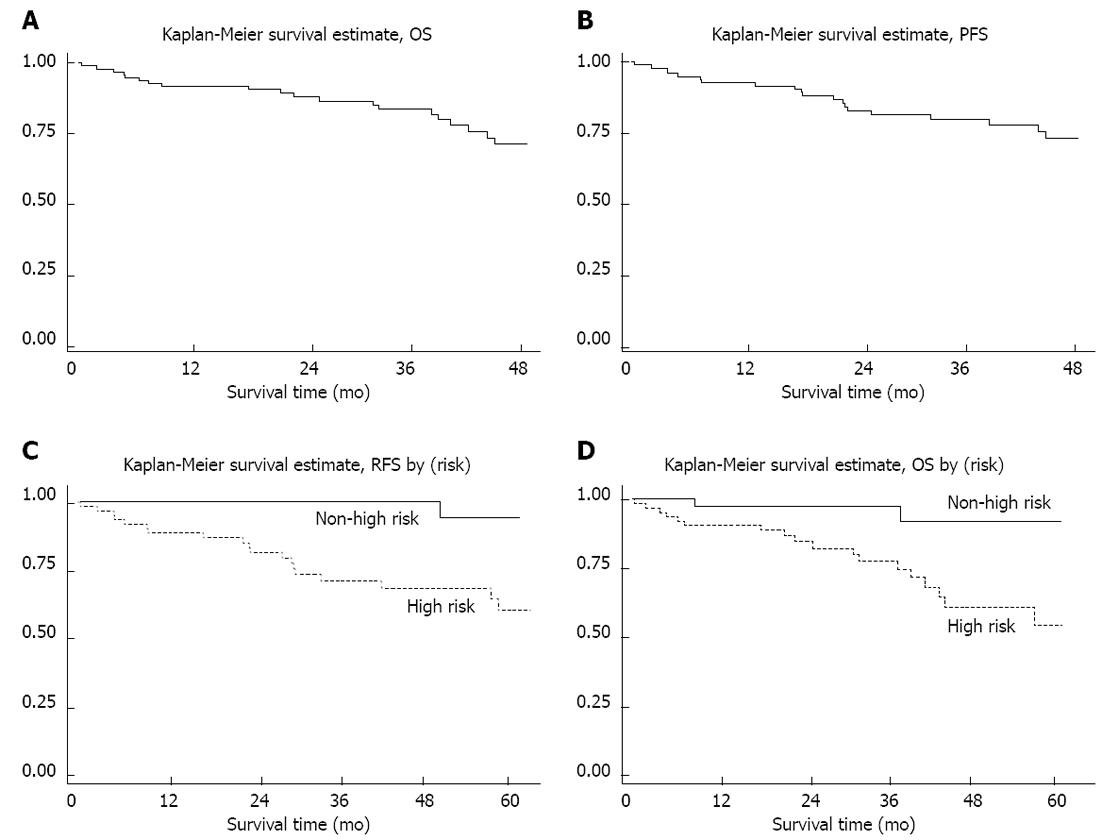
Figure 3 Kaplan-Meier survival probability curves.
Kaplan-Meier survival probability curves showing overall survival (OS) (A) progress free survival (PFS) (B), significant difference in the recurrent free survival (RFS) after surgery in primary resectable cases, comparing between the cases in the high risk group according to the National Institute of Health risk categorization, and the cases in the other risk groups (C) and significant difference in the OS (D).
- Citation: Pornsuksiri K, Chewatanakornkul S, Kanngurn S, Maneechay W, Chaiyapan W, Sangkhathat S. Clinical outcomes of gastrointestinal stromal tumor in southern Thailand. World J Gastrointest Oncol 2012; 4(11): 216-222
- URL: https://www.wjgnet.com/1948-5204/full/v4/i11/216.htm
- DOI: https://dx.doi.org/10.4251/wjgo.v4.i11.216


