Copyright
©2010 Baishideng Publishing Group Co.
World J Gastrointest Oncol. Dec 15, 2010; 2(12): 429-442
Published online Dec 15, 2010. doi: 10.4251/wjgo.v2.i12.429
Published online Dec 15, 2010. doi: 10.4251/wjgo.v2.i12.429
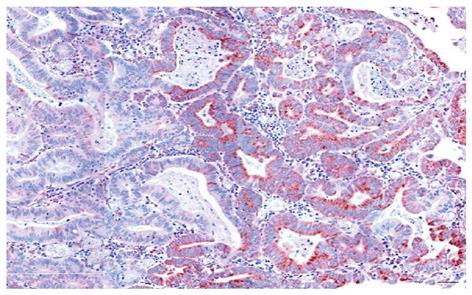
Figure 5 Image of colonic adenocarcinoma showing an area of high cytochrome c oxidase I expression (brown) adjacent to an area of low cytochrome c oxidase I expression.
Bar shows 50 μm.
-
Citation: Bernstein C, Facista A, Nguyen H, Zaitlin B, Hassounah N, Loustaunau C, Payne CM, Banerjee B, Goldschmid S, Tsikitis VL, Krouse R, Bernstein H. Cancer and age related colonic crypt deficiencies in cytochrome
c oxidase I. World J Gastrointest Oncol 2010; 2(12): 429-442 - URL: https://www.wjgnet.com/1948-5204/full/v2/i12/429.htm
- DOI: https://dx.doi.org/10.4251/wjgo.v2.i12.429


