
















Copyright: ©Author(s) 2026.
World J Gastrointest Oncol. Aug 15, 2026; 18(8): 119834
Published online Aug 15, 2026. doi: 10.4251/wjgo.119834
Published online Aug 15, 2026. doi: 10.4251/wjgo.119834
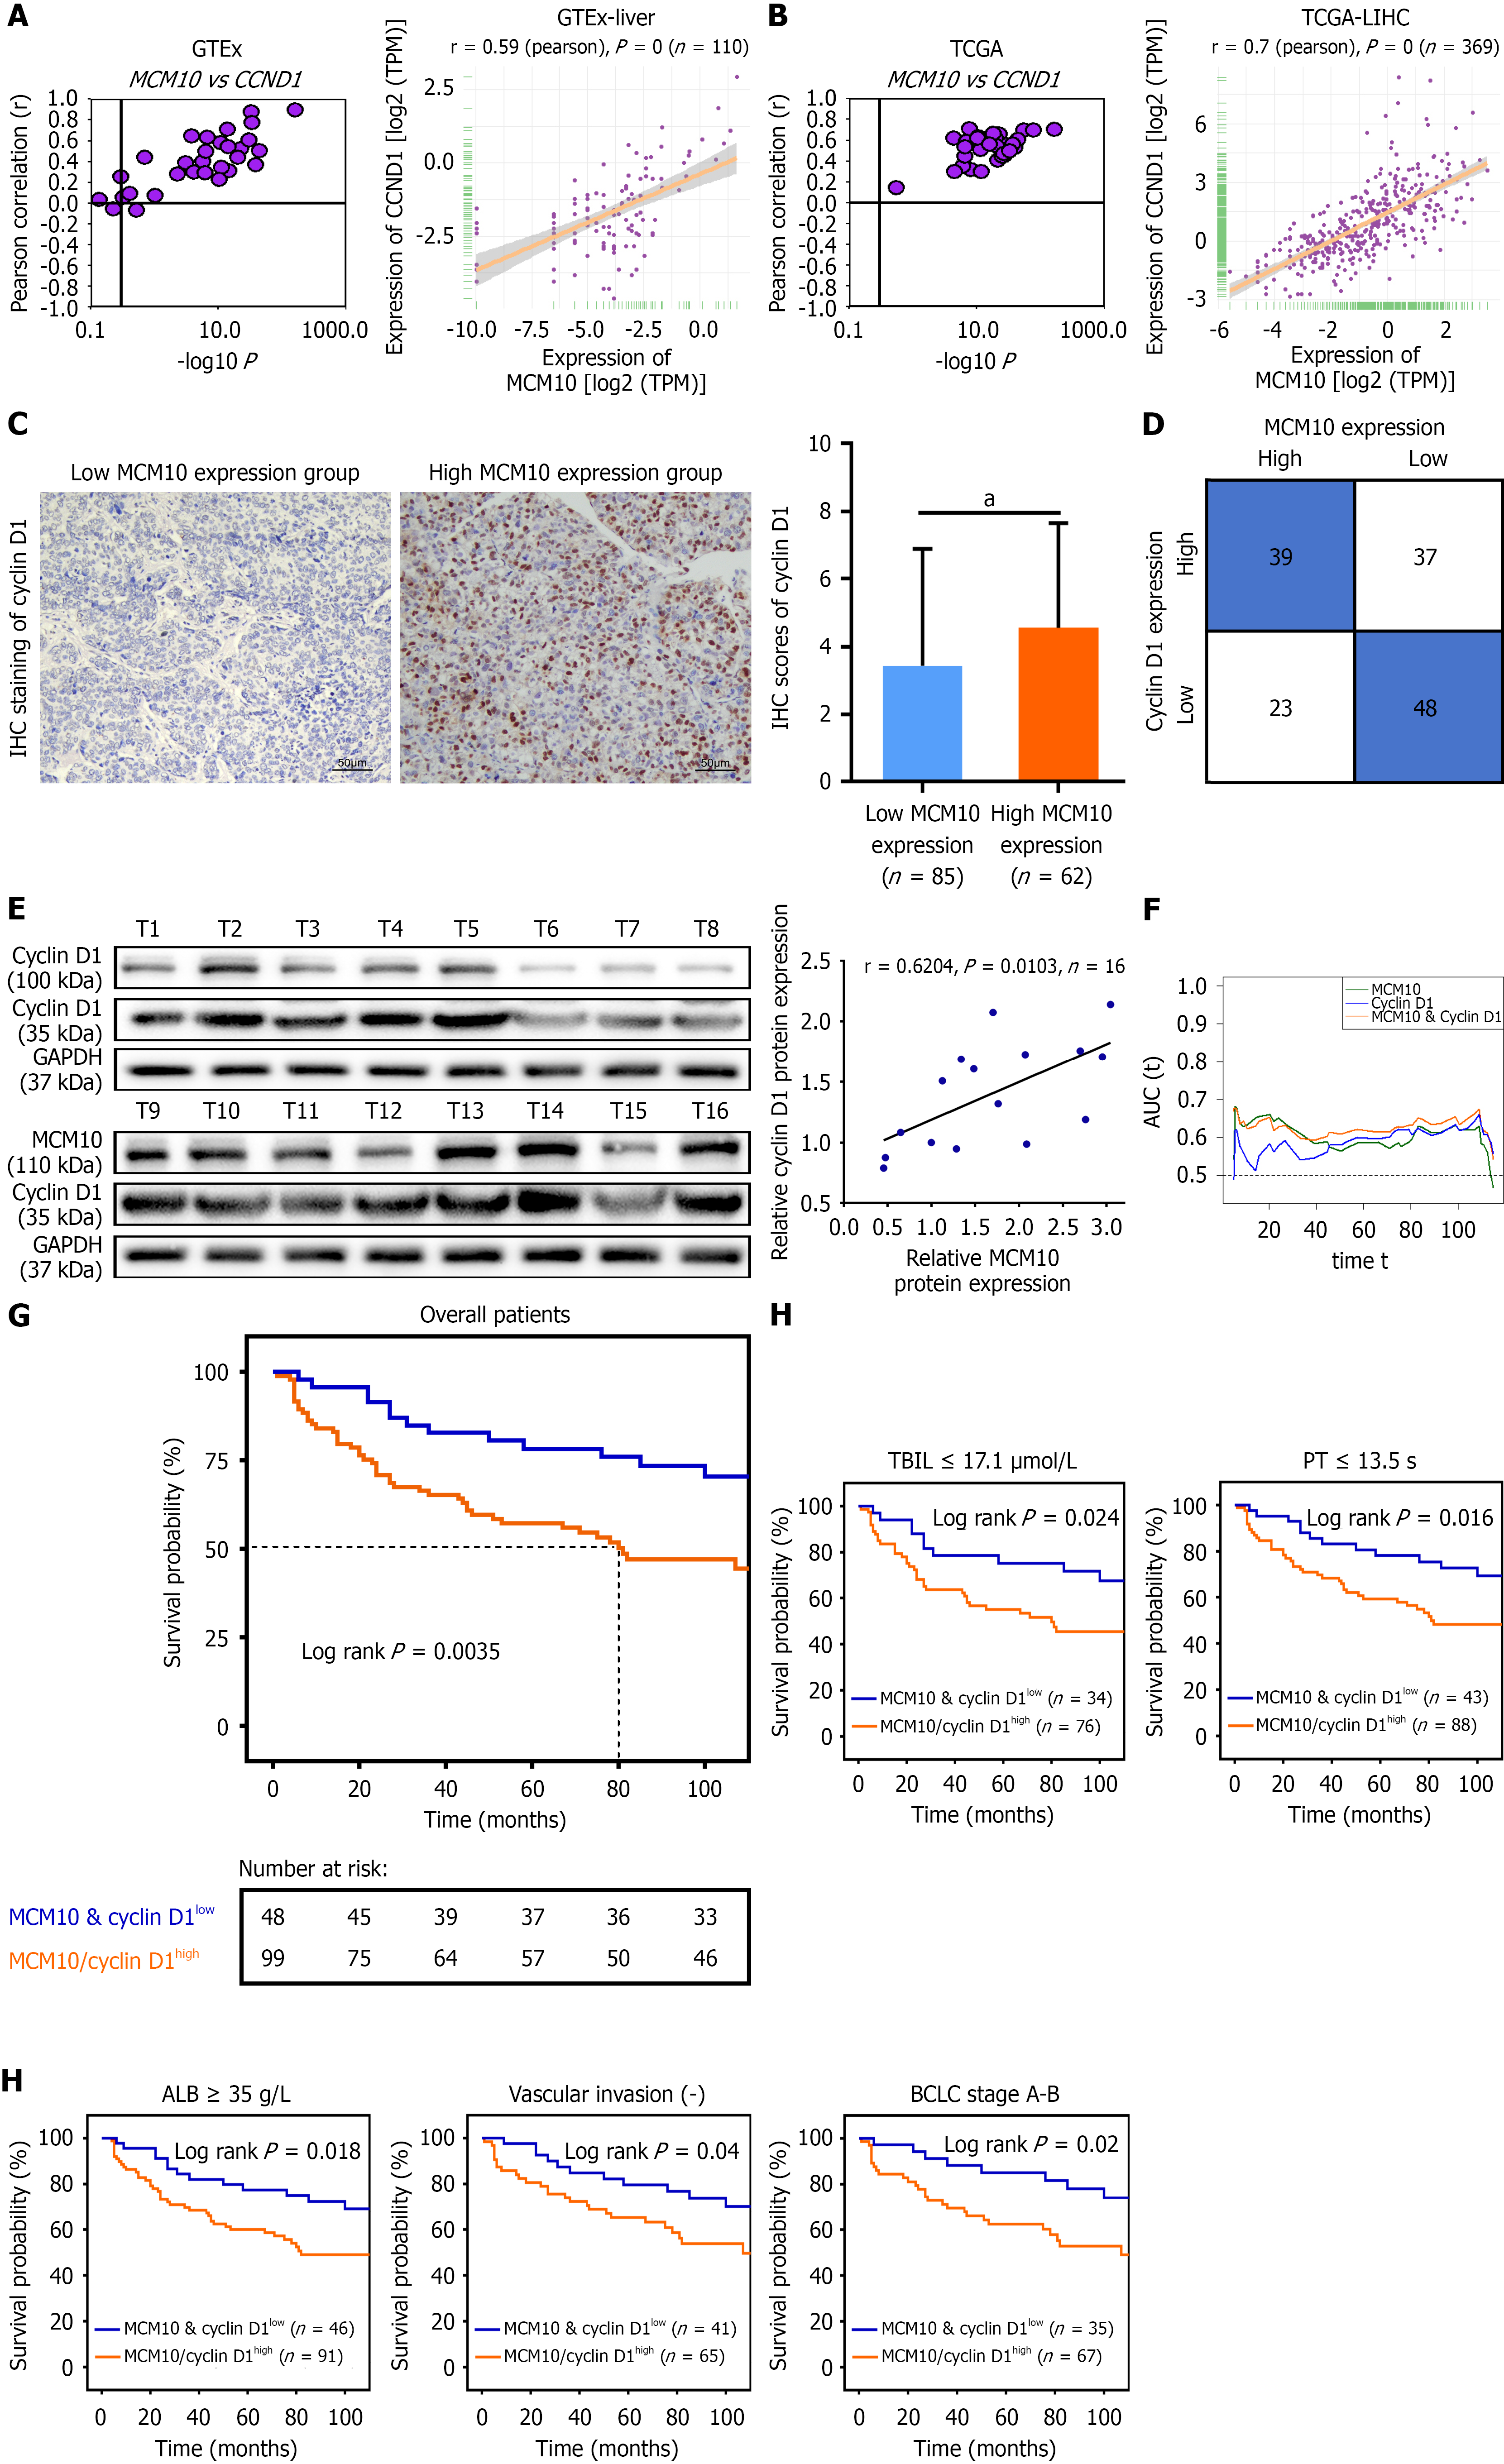
Figure 5 MCM10 upregulated cyclin D1 expression in hepatocellular carcinoma.
A and B: Correlation of MCM10 with cyclin D1 expression in normal tissues and cancer samples based on the data from Genotype Tissue Expression and The Cancer Genome Atlas; C: Representative immunohistochemistry staining of MCM10 and Cyclin D1 in hepatocellular carcinoma (HCC) tissues. Scale bar: 25 μm. n = 147; D: Cyclin D1 expression levels were compared between MCM10 low expression group and MCM10 high expression group; E: Western blot analysis of MCM10 and cyclin D1 expression in 16 freshly collected HCC samples (left). The correlation of MCM10 and cyclin D1 expression is shown on the right; F: Time-dependent receiver operating characteristic curves for either MCM10 or cyclin D1 alone or in combination in predicting overall survival of HCC patients; G and H: Prognostic value of combination of MCM10 and cyclin D1 in overall HCC patients and different subgroups. aP < 0.05. TCGA: The Cancer Genome Atlas; GTEx: Genotype Tissue Expression; IHC: Immunohistochemistry; BCLC: Barcelona Clinic Liver Cancer; TBil: Total bilirubin; PT: Prothrombin time; ALB: Albumin.
- Citation: Chen YR, Wang G, He LJ, Ye HW, Wang LF, Zou DD, Wang MQ, Xie HW, Zhu SL, Wang XY. MCM10 promotes hepatocellular carcinoma progression through cyclin D1 regulation. World J Gastrointest Oncol 2026; 18(8): 119834
- URL: https://www.wjgnet.com/1948-5204/full/v18/i8/119834.htm
- DOI: https://dx.doi.org/10.4251/wjgo.119834