
















Copyright: ©Author(s) 2026.
World J Gastrointest Oncol. Aug 15, 2026; 18(8): 116937
Published online Aug 15, 2026. doi: 10.4251/wjgo.116937
Published online Aug 15, 2026. doi: 10.4251/wjgo.116937
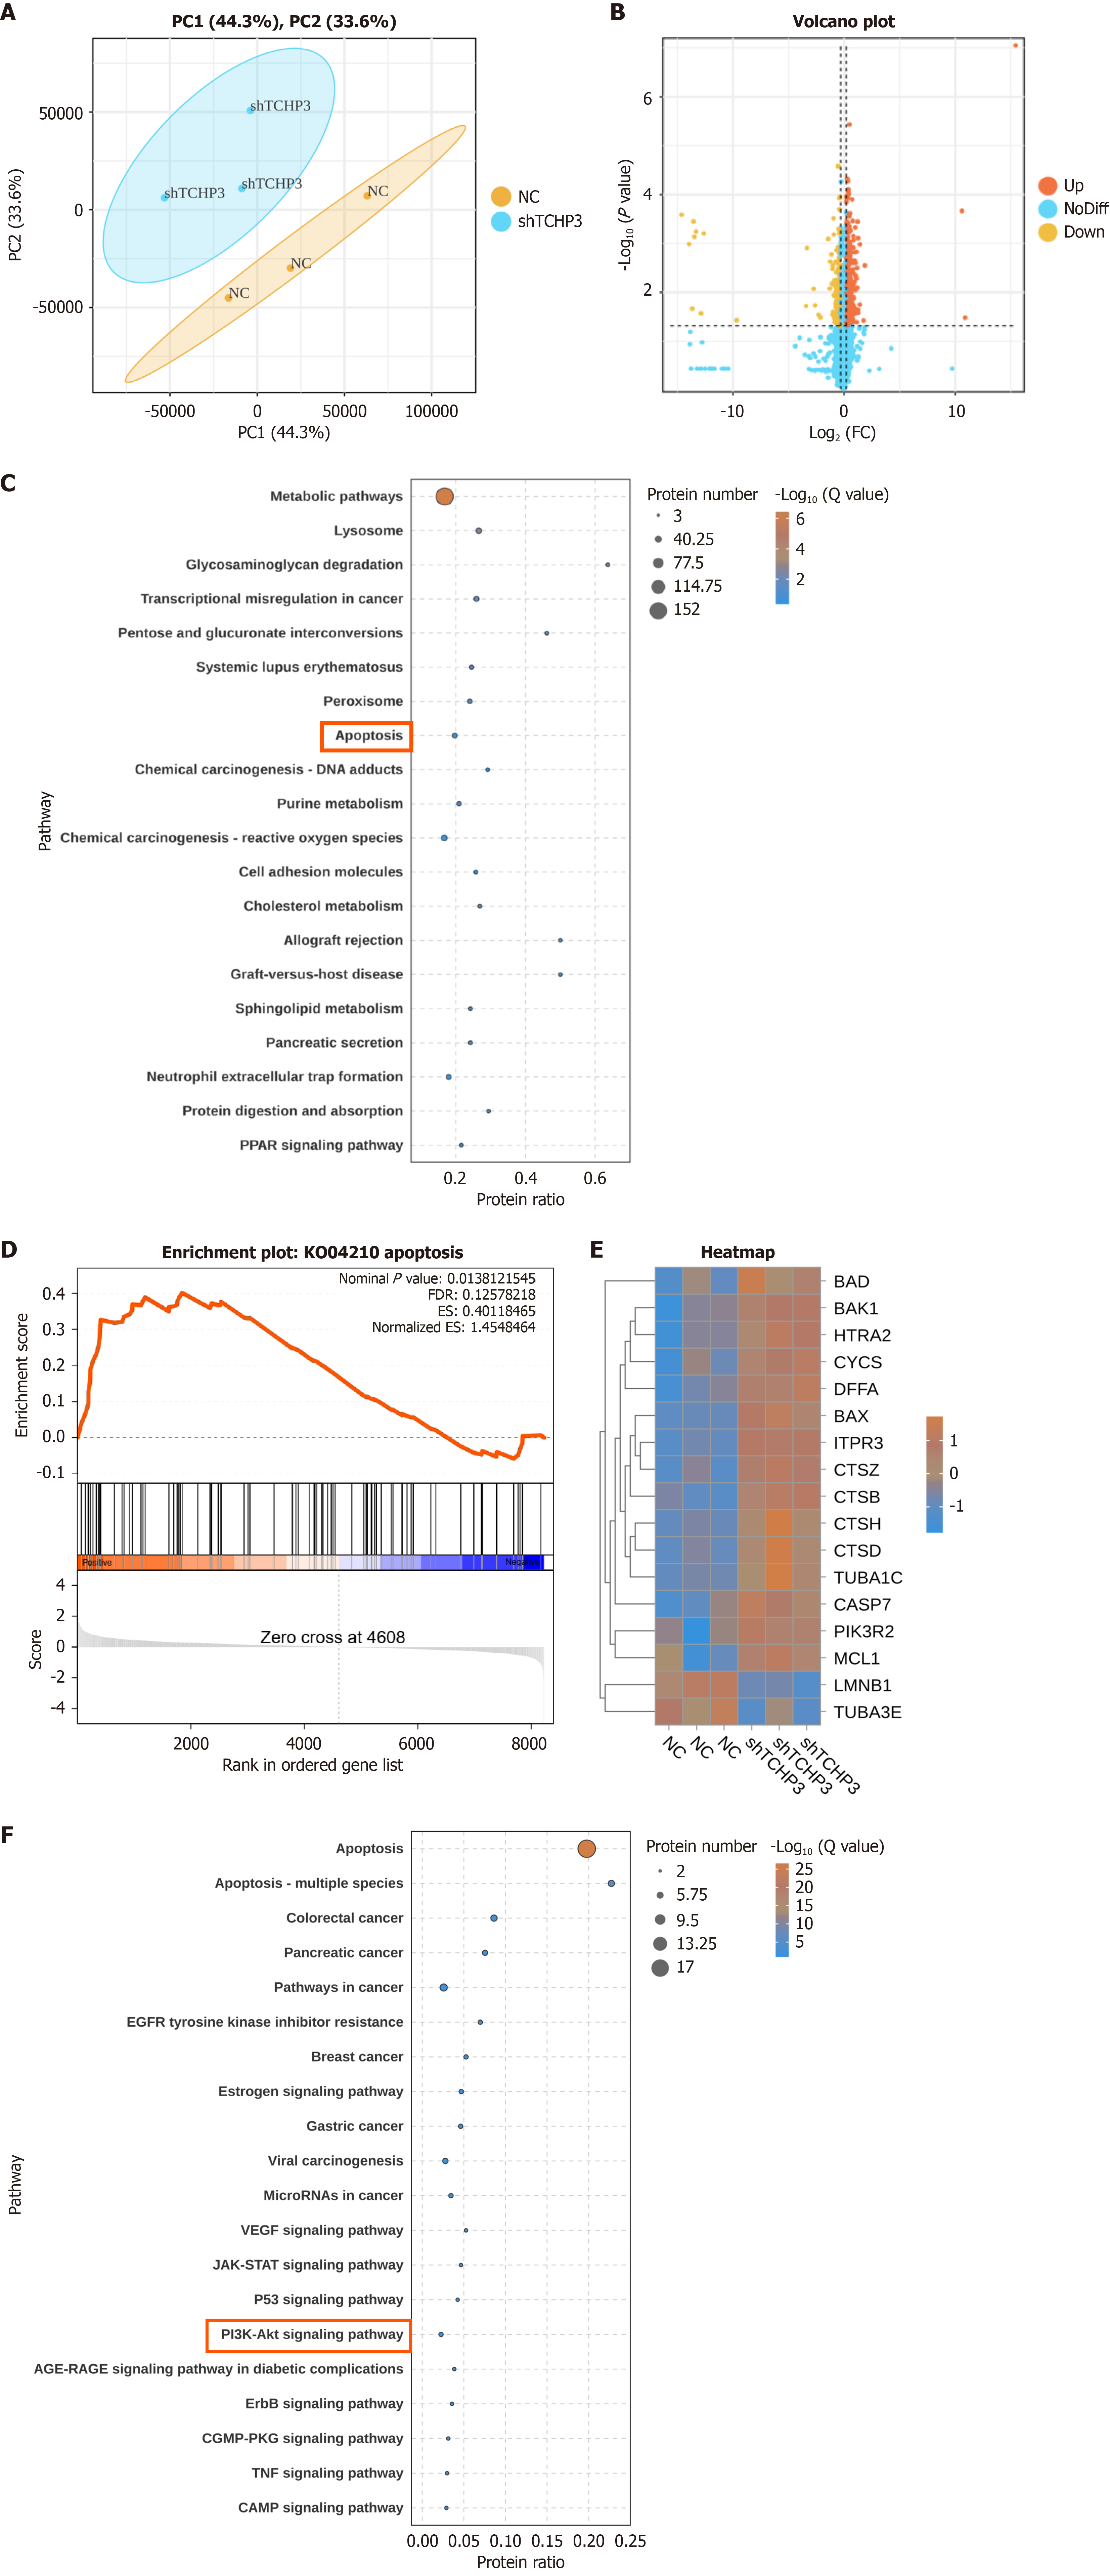
Figure 3 Proteomic analysis identifies differentially expressed proteins following TCHP knockdown.
A: Principal component analysis demonstrates distinct clustering between negative and shTCHP3 groups; B: Volcano plot shows the distribution of differentially expressed proteins (DEPs); C: Kyoto Encyclopedia of Genes and Genomes (KEGG) pathway analysis reveals significant enrichment in metabolic and apoptosis pathways; D: Gene set enrichment analysis indicates a significant upregulation of the apoptosis pathway in TCHP-knockdown gastric cancer cells; E: A heatmap shows the expression levels of key DEPs in the apoptosis pathway; F: KEGG secondary enrichment analysis identifies significant enrichment of proteins in the PI3K/AKT pathway.
- Citation: Wang Y, Zhang TY, Shen YF, Shen N, Zhang ZW. TCHP regulates the proliferation and apoptosis of gastric cancer cells via AKT/BCL2 signaling pathway. World J Gastrointest Oncol 2026; 18(8): 116937
- URL: https://www.wjgnet.com/1948-5204/full/v18/i8/116937.htm
- DOI: https://dx.doi.org/10.4251/wjgo.116937