
















Copyright: ©Author(s) 2026.
World J Gastrointest Oncol. Jul 15, 2026; 18(7): 120582
Published online Jul 15, 2026. doi: 10.4251/wjgo.120582
Published online Jul 15, 2026. doi: 10.4251/wjgo.120582
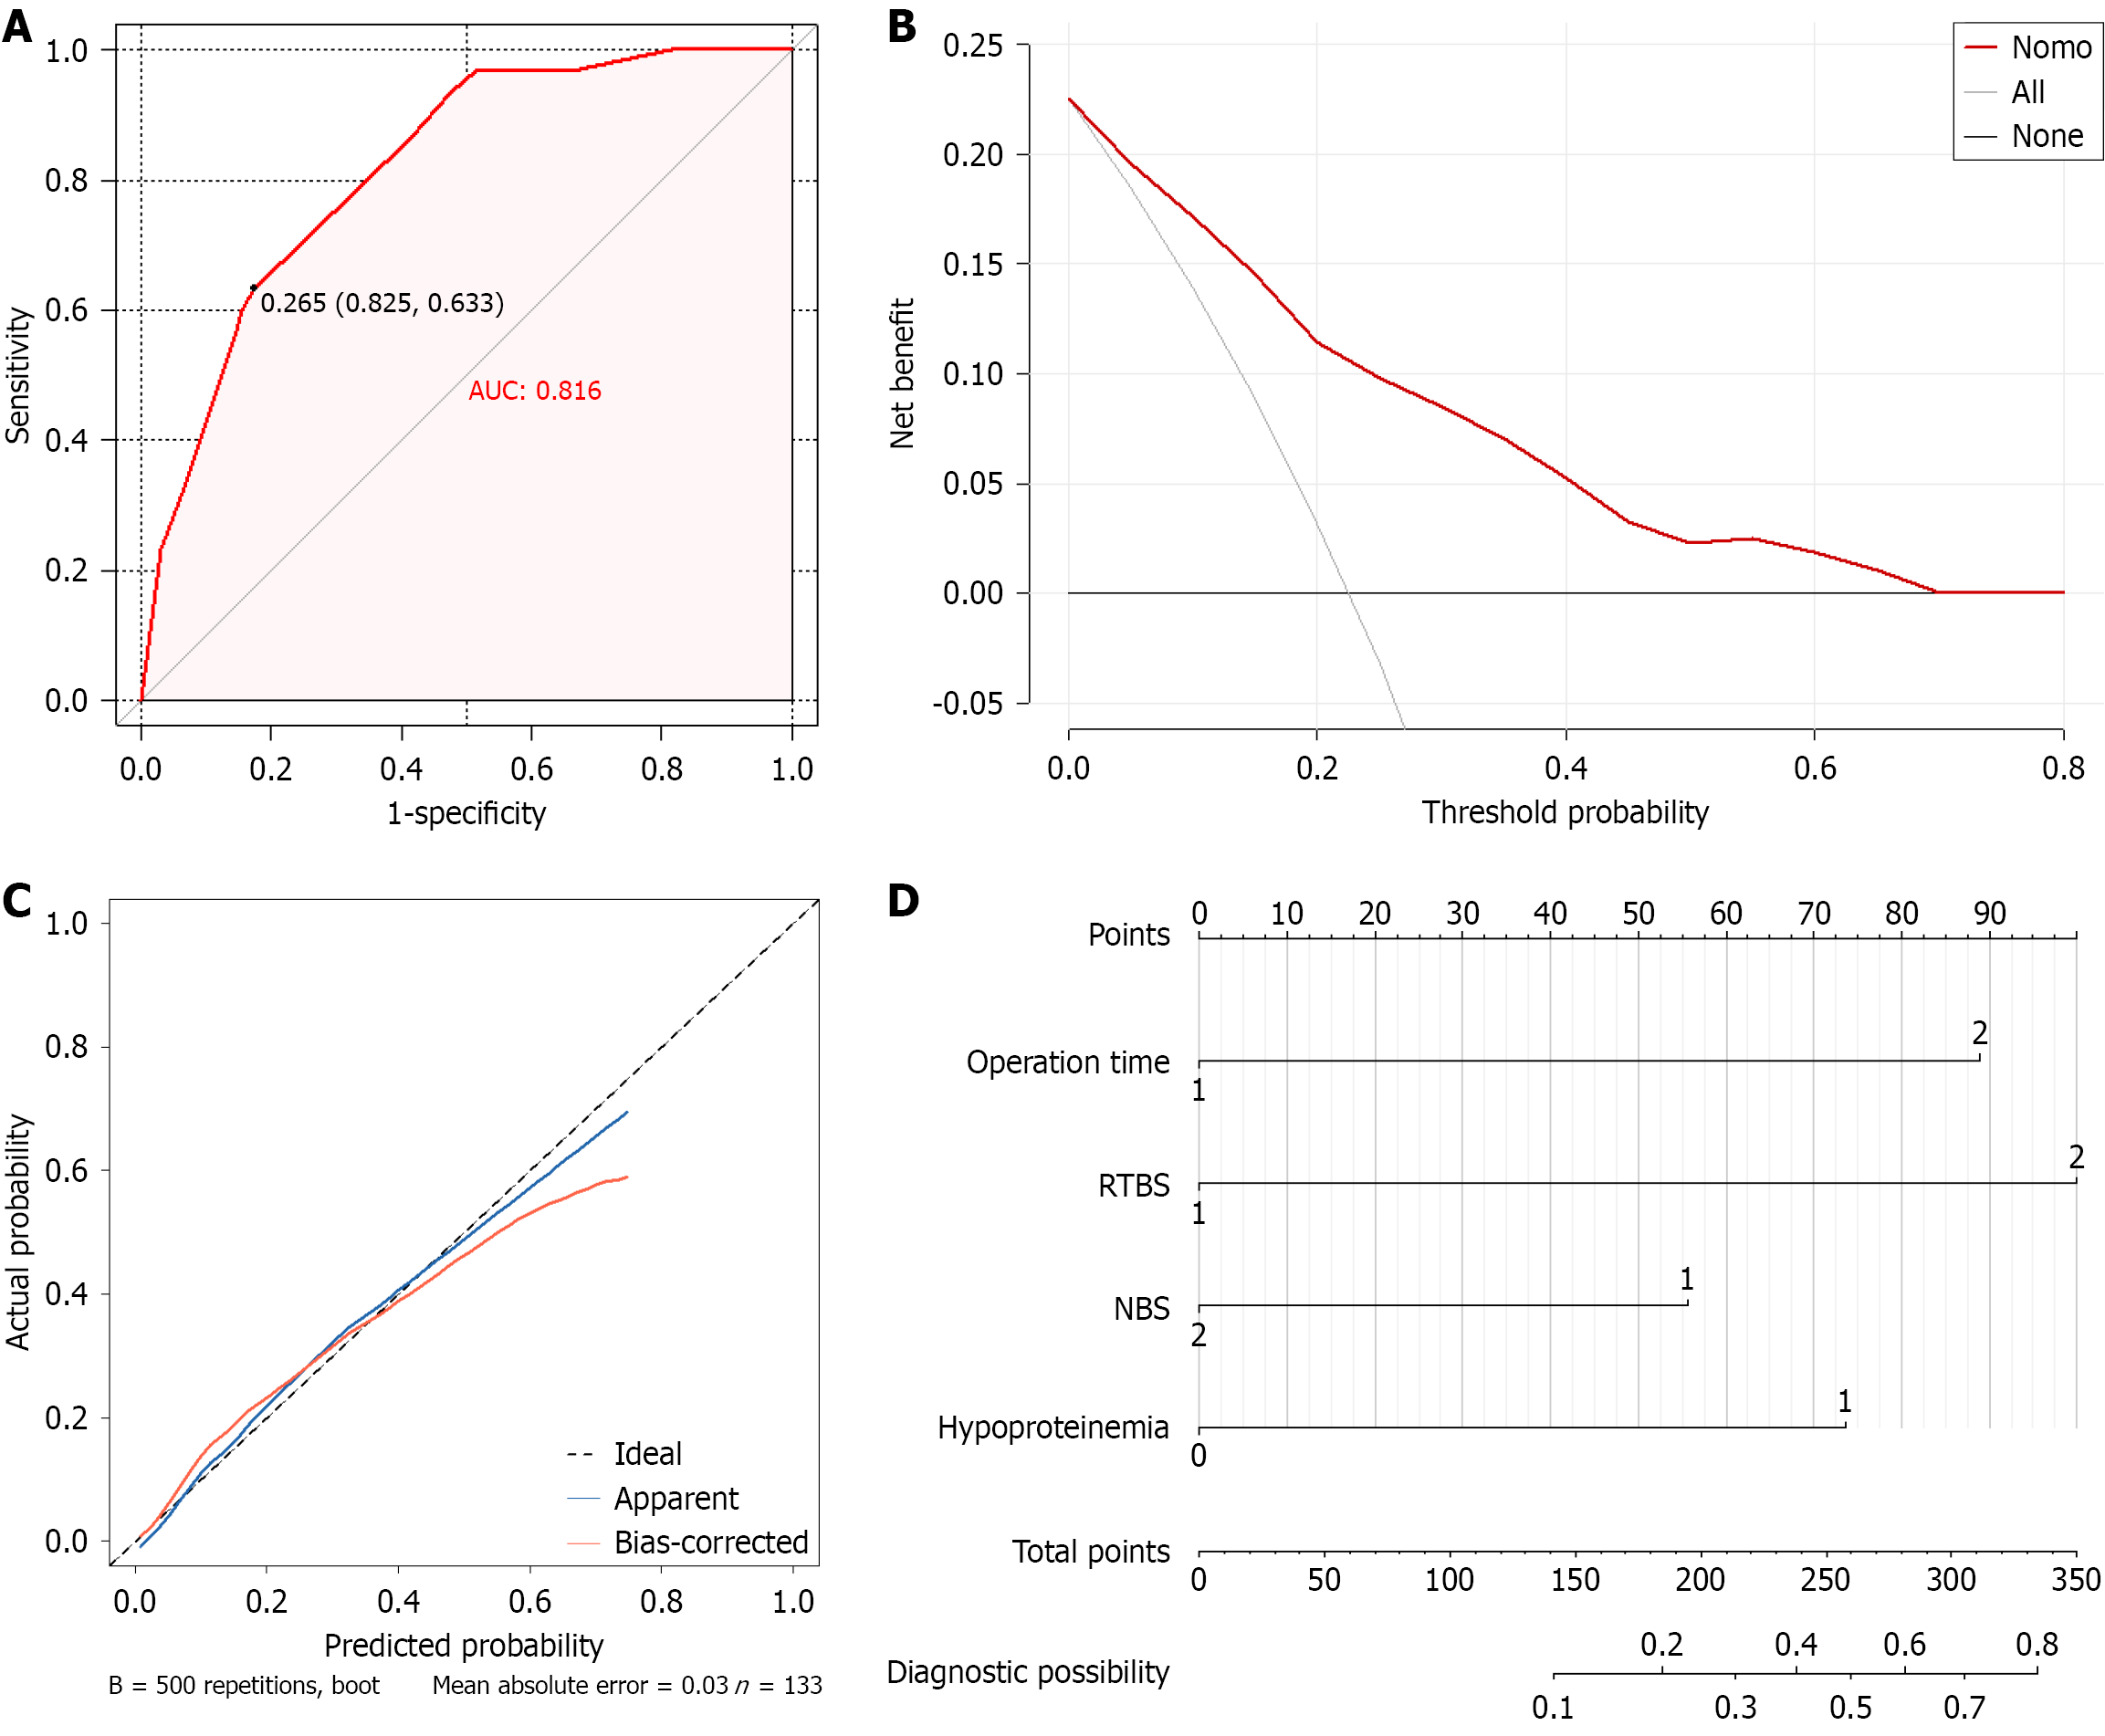
Figure 8 Performance evaluation graph of predictive model.
A: The receiver operating characteristic curve assesses the predictive model for postoperative prolonged postoperative ileus in colorectal cancer, area under the curve = 0.816; B: Decision curve analysis is used to assess the predictive model, indicating it has a good clinical net benefit; C: Calibration curve reflects how closely the predicted risk matches the actual risk; D: The nomogram highlights how different factors influence disease diagnosis. AUC: Area under the curve; RTBS: Recovery time of bowel sounds; NBS: Number of bowel sounds.
- Citation: Shi S, Wang C, Zhao CS, Chen Z, Yan L, Liang Y, Yue X, Duan XL, Wang ZZ. Clinical study predicting prolonged postoperative ileus after laparoscopic colorectal cancer surgery with intelligent bowel sound auscultation system. World J Gastrointest Oncol 2026; 18(7): 120582
- URL: https://www.wjgnet.com/1948-5204/full/v18/i7/120582.htm
- DOI: https://dx.doi.org/10.4251/wjgo.120582