
















Copyright: ©Author(s) 2026.
World J Gastrointest Oncol. Jul 15, 2026; 18(7): 120582
Published online Jul 15, 2026. doi: 10.4251/wjgo.120582
Published online Jul 15, 2026. doi: 10.4251/wjgo.120582
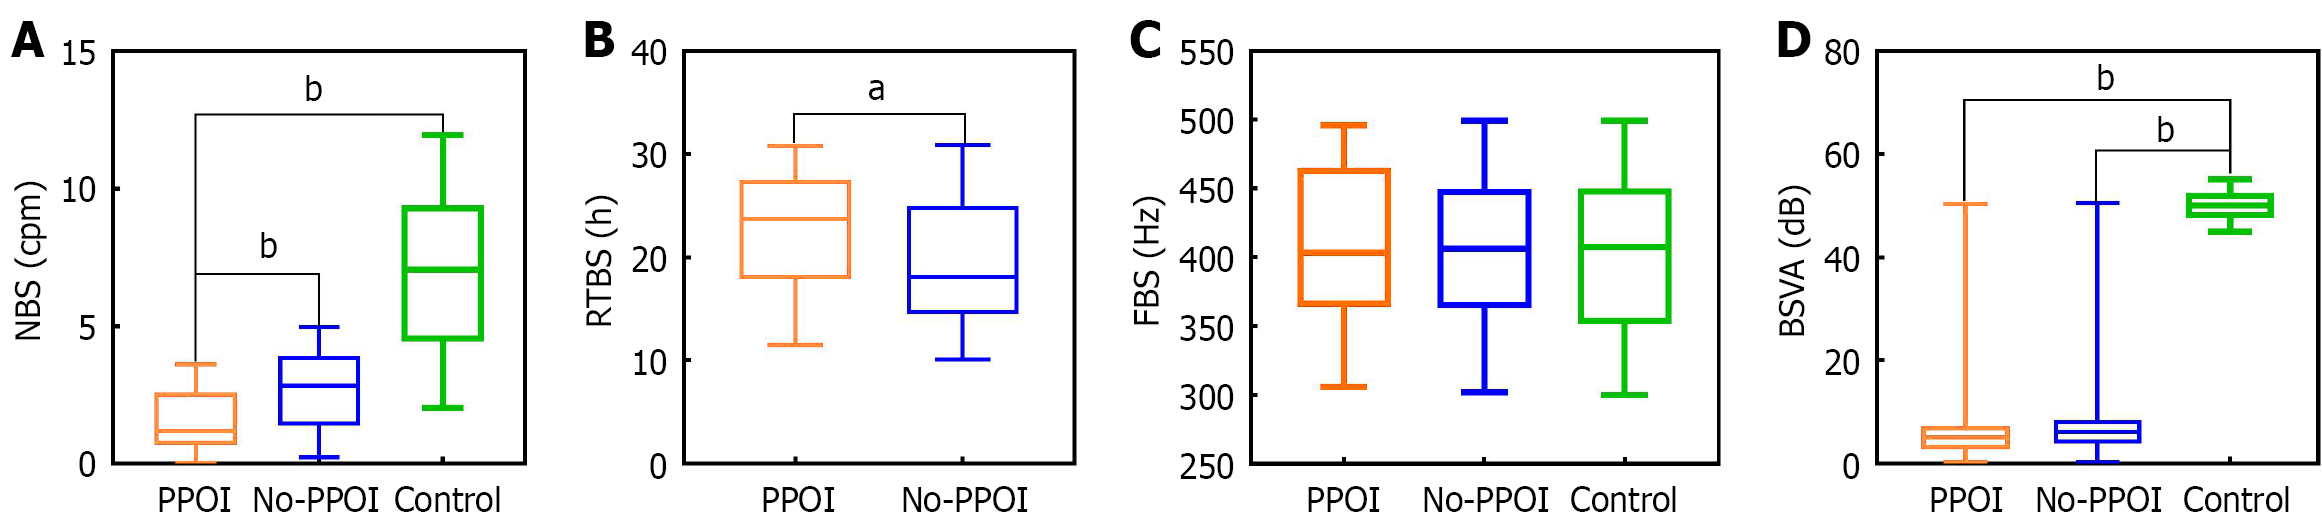
Figure 4 Comparison chart of bowel sounds indicators on the first postoperative day among different groups of patients.
A: Comparison of number of bowel sounds differences on the first postoperative day, with significant differences between the prolonged postoperative ileus (PPOI) group and the no-PPOI group as well as the blank control group; B: Comparison of recovery time of bowel sounds differences, with significant differences between the PPOI group and the no-PPOI group; C: Comparison of FBS differences on the first postoperative day, with no significant differences among the PPOI group, no-PPOI group, and blank control group; D: Comparison of bowel sound vibration amplitude differences on the first postoperative day, with no statistical significance between the PPOI group and the no-PPOI group, but significant differences between the PPOI group and no-PPOI group compared to the blank control group. aP < 0.01; bP < 0.0001. NBS: Number of bowel sounds; cpm: Counts per minute; RTBS: Recovery time of bowel sounds; FBS: Frequency of bowel sounds; BSVA: Bowel sound vibration amplitude; PPOI: Prolonged postoperative ileus.
- Citation: Shi S, Wang C, Zhao CS, Chen Z, Yan L, Liang Y, Yue X, Duan XL, Wang ZZ. Clinical study predicting prolonged postoperative ileus after laparoscopic colorectal cancer surgery with intelligent bowel sound auscultation system. World J Gastrointest Oncol 2026; 18(7): 120582
- URL: https://www.wjgnet.com/1948-5204/full/v18/i7/120582.htm
- DOI: https://dx.doi.org/10.4251/wjgo.120582