
















Copyright: ©Author(s) 2026.
World J Gastrointest Oncol. Jul 15, 2026; 18(7): 120582
Published online Jul 15, 2026. doi: 10.4251/wjgo.120582
Published online Jul 15, 2026. doi: 10.4251/wjgo.120582
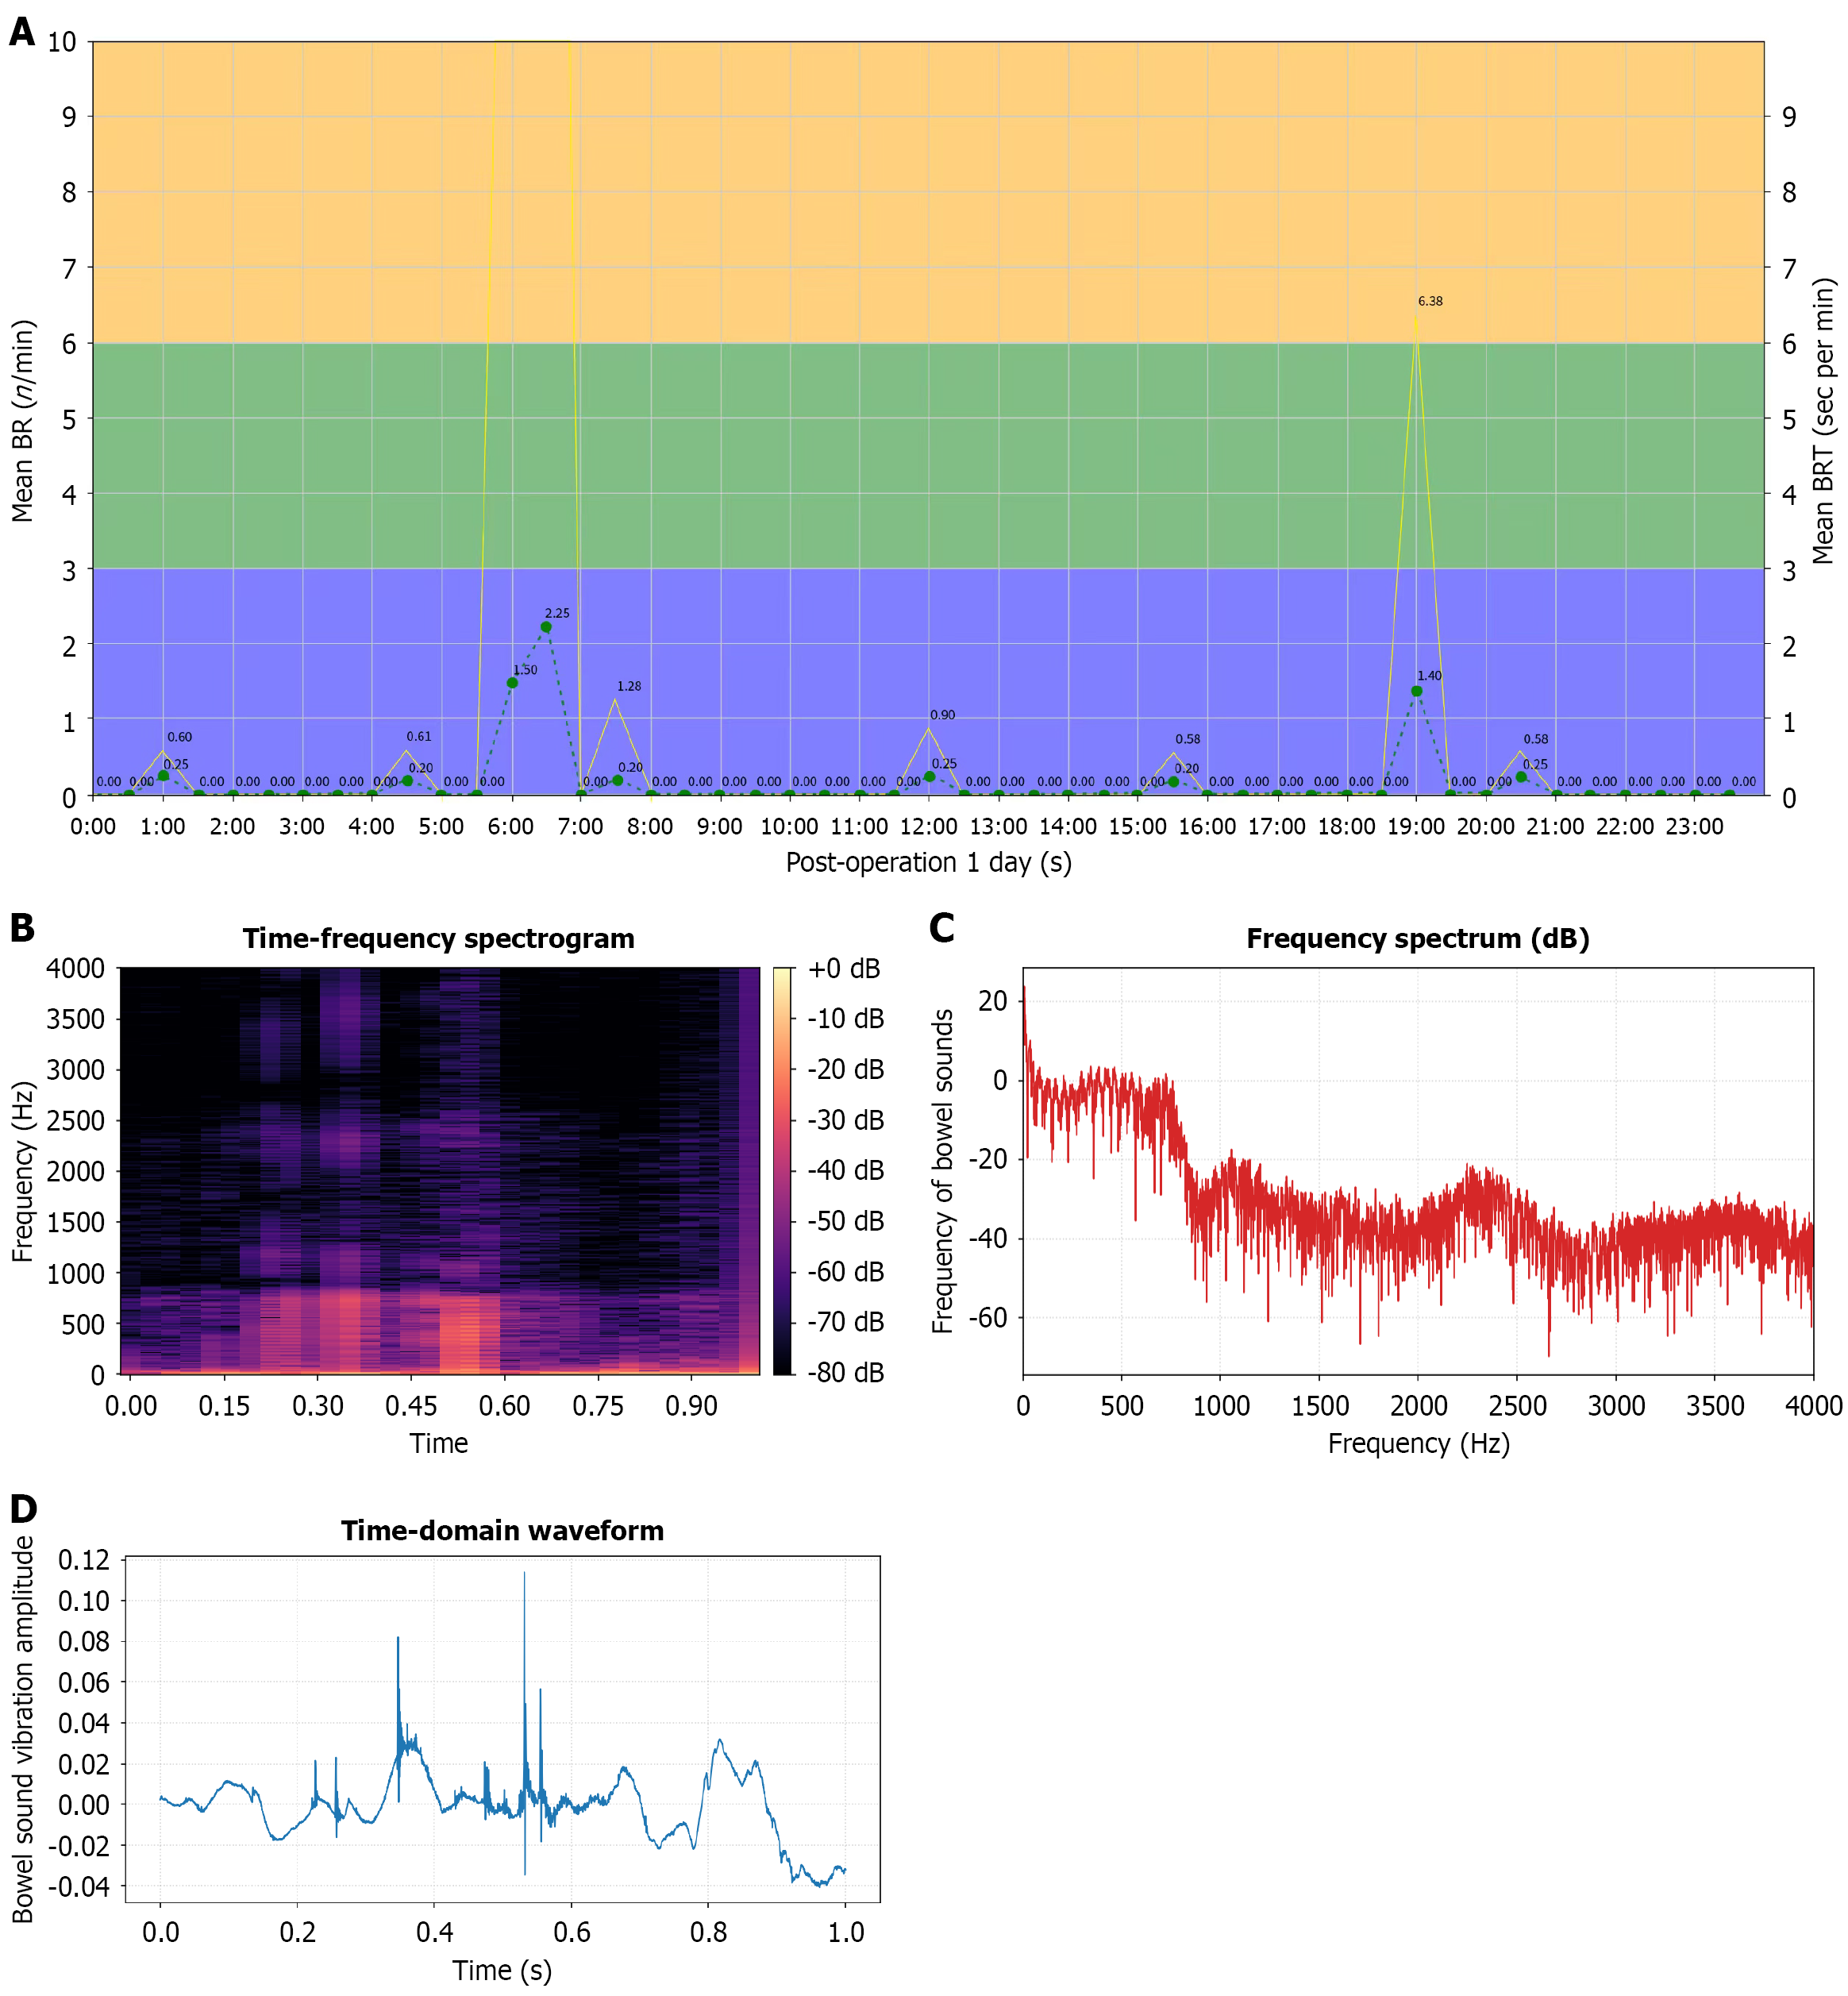
Figure 3 Characteristics of intestinal sounds diagram display.
A: Diagram showing changes in the number of bowel sounds at different times on post-operation 1 day, where blue represents the area of weakened intestinal sounds, green represents the area of normal intestinal sounds, and yellow represents the area of increased intestinal sounds; B: Frequency of chart of intestinal sounds, showing the relationship between detected intestinal sounds and time over a period; C: Display of frequency of bowel sounds analysis; D: Display of bowel sound vibration amplitude analysis. BR: Bowel rate.
- Citation: Shi S, Wang C, Zhao CS, Chen Z, Yan L, Liang Y, Yue X, Duan XL, Wang ZZ. Clinical study predicting prolonged postoperative ileus after laparoscopic colorectal cancer surgery with intelligent bowel sound auscultation system. World J Gastrointest Oncol 2026; 18(7): 120582
- URL: https://www.wjgnet.com/1948-5204/full/v18/i7/120582.htm
- DOI: https://dx.doi.org/10.4251/wjgo.120582