
















Copyright: ©Author(s) 2026.
World J Gastrointest Oncol. Jul 15, 2026; 18(7): 119847
Published online Jul 15, 2026. doi: 10.4251/wjgo.v18.i7.119847
Published online Jul 15, 2026. doi: 10.4251/wjgo.v18.i7.119847
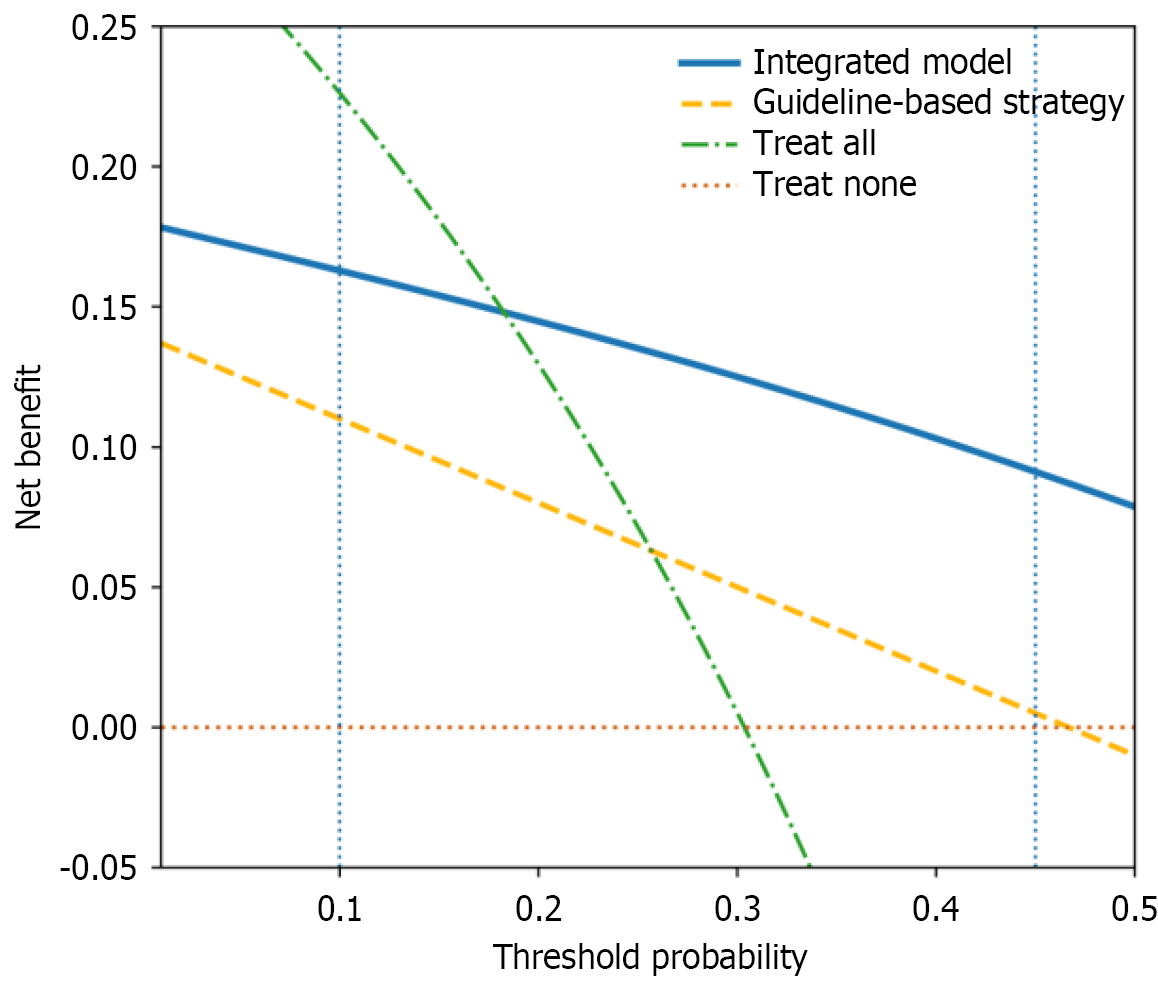
Figure 4 Decision curve analysis comparing net clinical benefit of the integrated model and guideline-based strategies.
Decision curve analysis illustrating net benefit across threshold probabilities between 5% and 50% for recommending surgical resection. The integrated multimodal model demonstrates superior net benefit across clinically relevant thresholds compared with guideline-based criteria. Horizontal lines represent “treat all” and “treat none” strategies. Because all patients in the cohort underwent resection, net benefit estimates reflect counterfactual model-based scenarios.
- Citation: Özden Y, Yüzügülen Ö, Omurca F. Interpretable multimodal artificial intelligence model for predicting advanced neoplasia in pancreatic cystic lesions. World J Gastrointest Oncol 2026; 18(7): 119847
- URL: https://www.wjgnet.com/1948-5204/full/v18/i7/119847.htm
- DOI: https://dx.doi.org/10.4251/wjgo.v18.i7.119847