
















Copyright: ©Author(s) 2026.
World J Gastrointest Oncol. Jul 15, 2026; 18(7): 118867
Published online Jul 15, 2026. doi: 10.4251/wjgo.v18.i7.118867
Published online Jul 15, 2026. doi: 10.4251/wjgo.v18.i7.118867
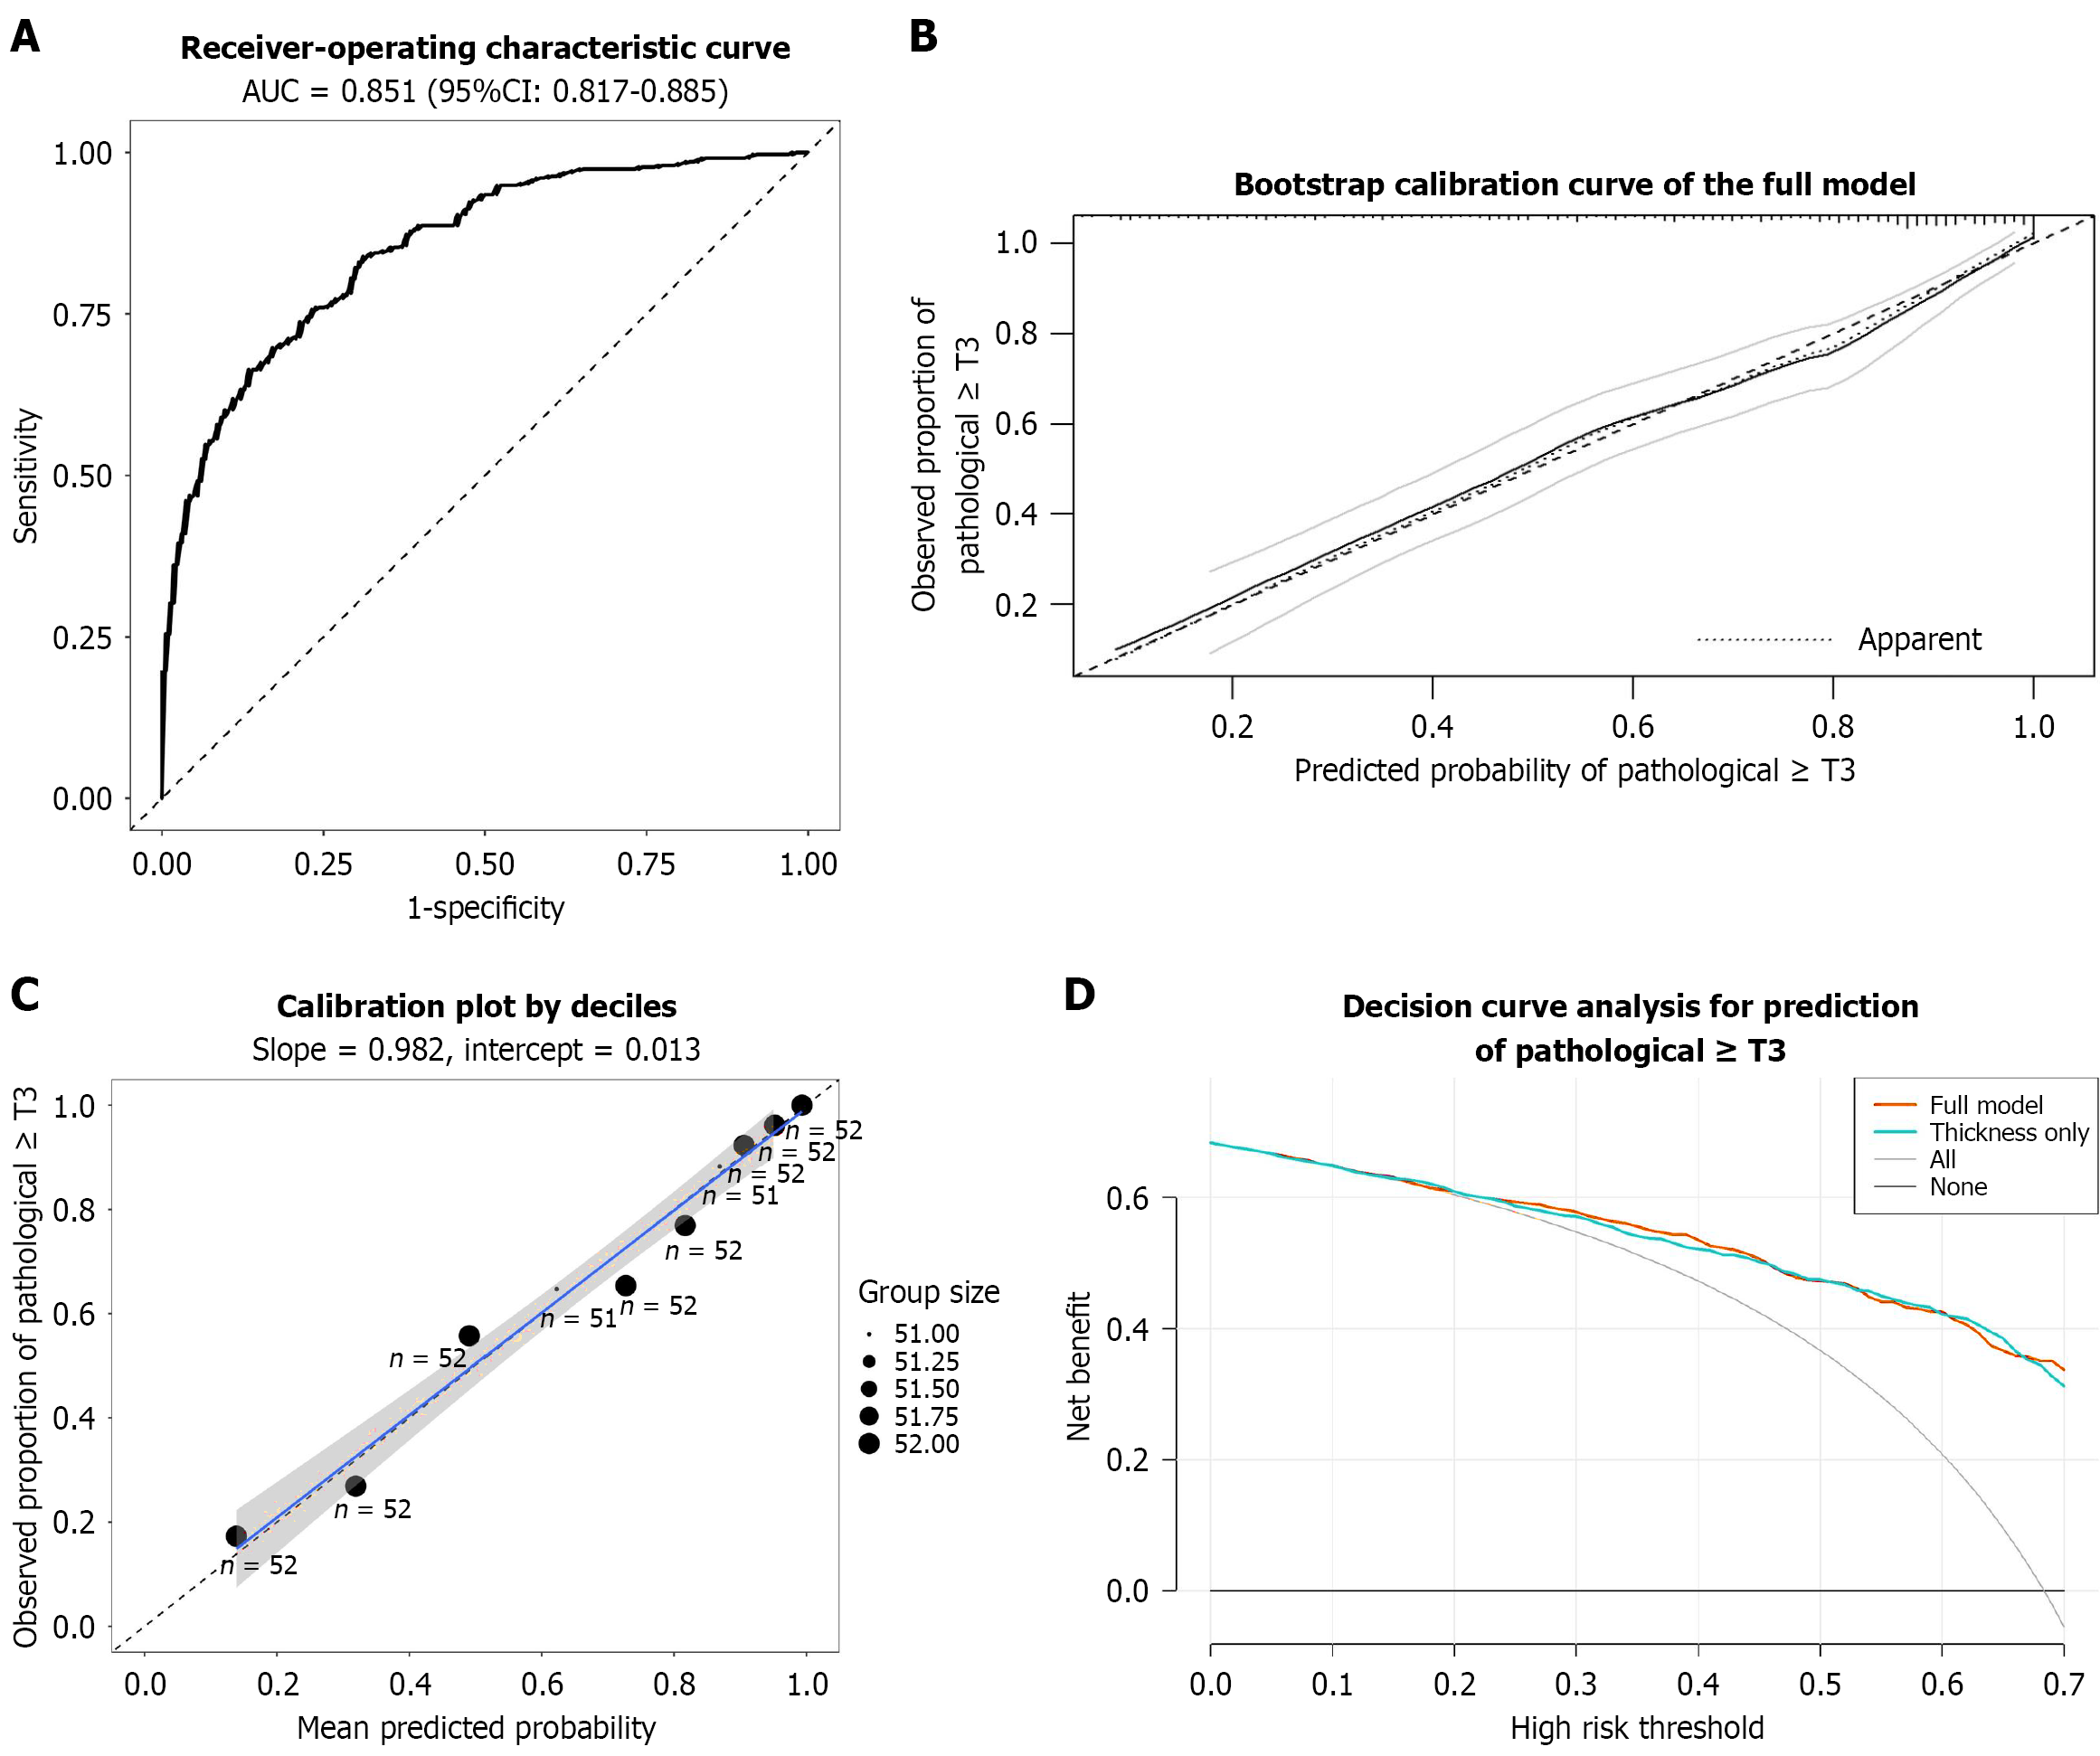
Figure 3 Performance of the preoperative prediction model for pathological ≥ pT3 gastric cancer.
A: Receiver-operating characteristic curve of the full multivariable logistic regression model in the development cohort (n = 518), with area under the receiver-operating characteristic curve and 95% confidence interval shown. The model includes endoscopic ultrasonography lesion thickness modelled with restricted cubic splines and routinely available clinical variables (Lauren classification, age, sex, tumour site, carcinoembryonic antigen, and carbohydrate antigen 19-9). The diagonal dashed line indicates no discrimination; B: Bootstrap calibration curve for the full model, comparing predicted probabilities with observed proportions of pathological ≥ pT3; the 45° line represents perfect calibration. Apparent performance is shown alongside the optimism-corrected calibration estimate; C: Decile-based calibration plot: Each point represents one decile of predicted risk, plotted as mean predicted probability (X-axis) against observed proportion of pathological ≥ pT3 (Y-axis), with point size reflecting group size. The reported slope and intercept are from logistic recalibration; D: Decision-curve analysis comparing net benefit across threshold probabilities (high-risk thresholds) for the full model vs a thickness-only model; “all” and “none” represent treat-all and treat-none strategies, respectively. AUC: Area under the receiver-operating cha
- Citation: Cao MY, Chen YF, Liao YX, Yang Q, Lin SY, Li Y, Weng J, Huang XX, Gao XY, Wang GB, Shan HB, Li JJ. Endoscopic ultrasonography lesion thickness predicts deep invasion in gastric cancer: Development and temporal validation of a preoperative model. World J Gastrointest Oncol 2026; 18(7): 118867
- URL: https://www.wjgnet.com/1948-5204/full/v18/i7/118867.htm
- DOI: https://dx.doi.org/10.4251/wjgo.v18.i7.118867