
















Copyright: ©Author(s) 2026.
World J Gastrointest Oncol. Jul 15, 2026; 18(7): 118867
Published online Jul 15, 2026. doi: 10.4251/wjgo.v18.i7.118867
Published online Jul 15, 2026. doi: 10.4251/wjgo.v18.i7.118867
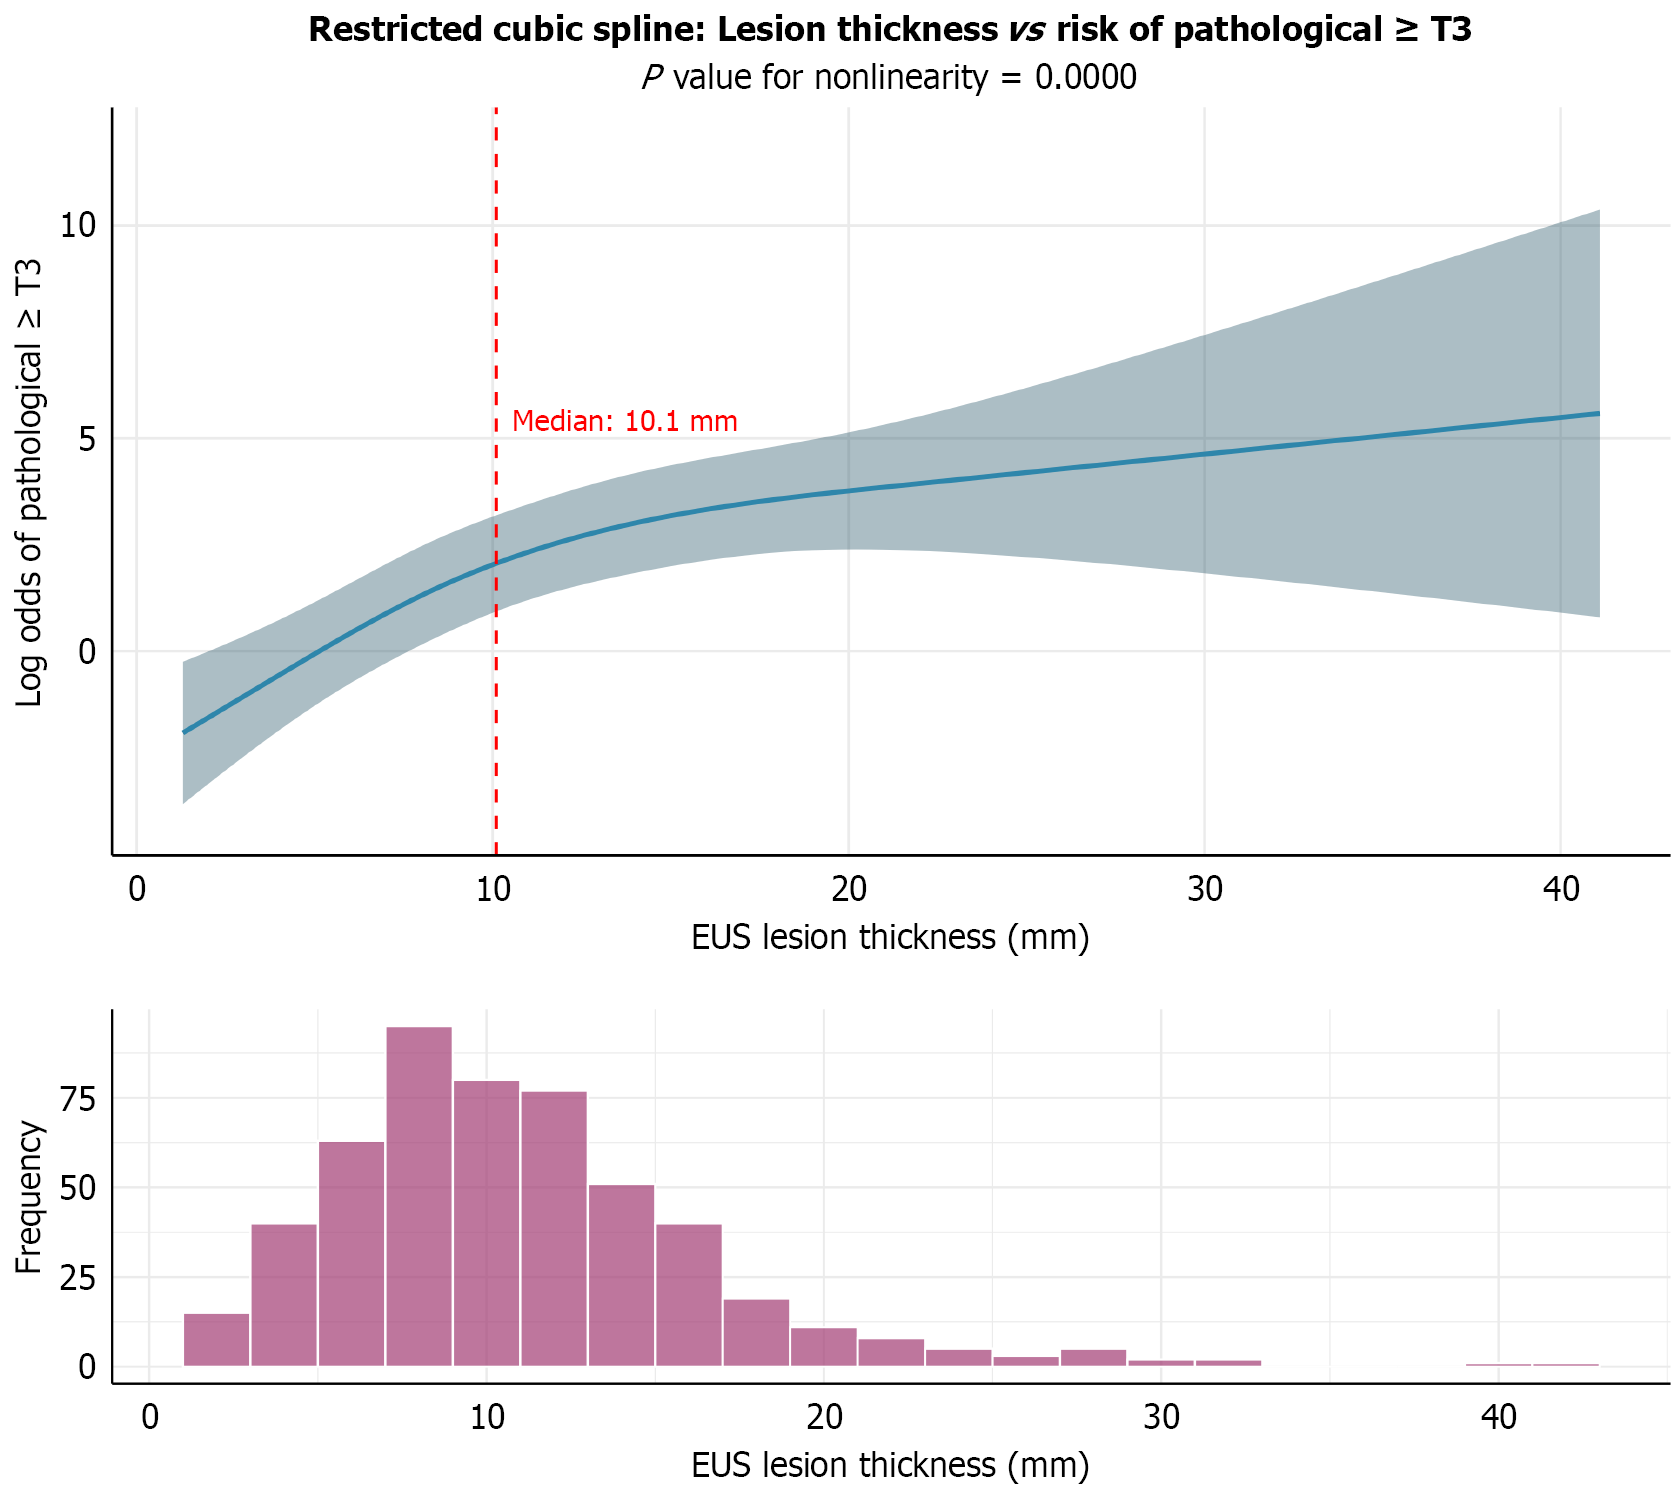
Figure 2 Association between endoscopic ultrasonography lesion thickness and pathological ≥ pT3.
The upper panel shows the restricted cubic spline function for endoscopic ultrasonography lesion thickness (mm) from the multivariable logistic regression model, illustrating the adjusted relationship between thickness and the log odds of pathological ≥ pT3. The solid curve represents the point estimate and the shaded band indicates the 95% confidence interval. The P value for nonlinearity is reported on the plot. The vertical dashed red line marks the median lesion thickness in the cohort (10.1 mm). The lower panel displays the histogram of endoscopic ultrasonography lesion thickness values (frequency distribution) in the study population. EUS: Endoscopic ultrasonography.
- Citation: Cao MY, Chen YF, Liao YX, Yang Q, Lin SY, Li Y, Weng J, Huang XX, Gao XY, Wang GB, Shan HB, Li JJ. Endoscopic ultrasonography lesion thickness predicts deep invasion in gastric cancer: Development and temporal validation of a preoperative model. World J Gastrointest Oncol 2026; 18(7): 118867
- URL: https://www.wjgnet.com/1948-5204/full/v18/i7/118867.htm
- DOI: https://dx.doi.org/10.4251/wjgo.v18.i7.118867