
















Copyright: ©Author(s) 2026.
World J Gastrointest Oncol. Jul 15, 2026; 18(7): 118787
Published online Jul 15, 2026. doi: 10.4251/wjgo.118787
Published online Jul 15, 2026. doi: 10.4251/wjgo.118787
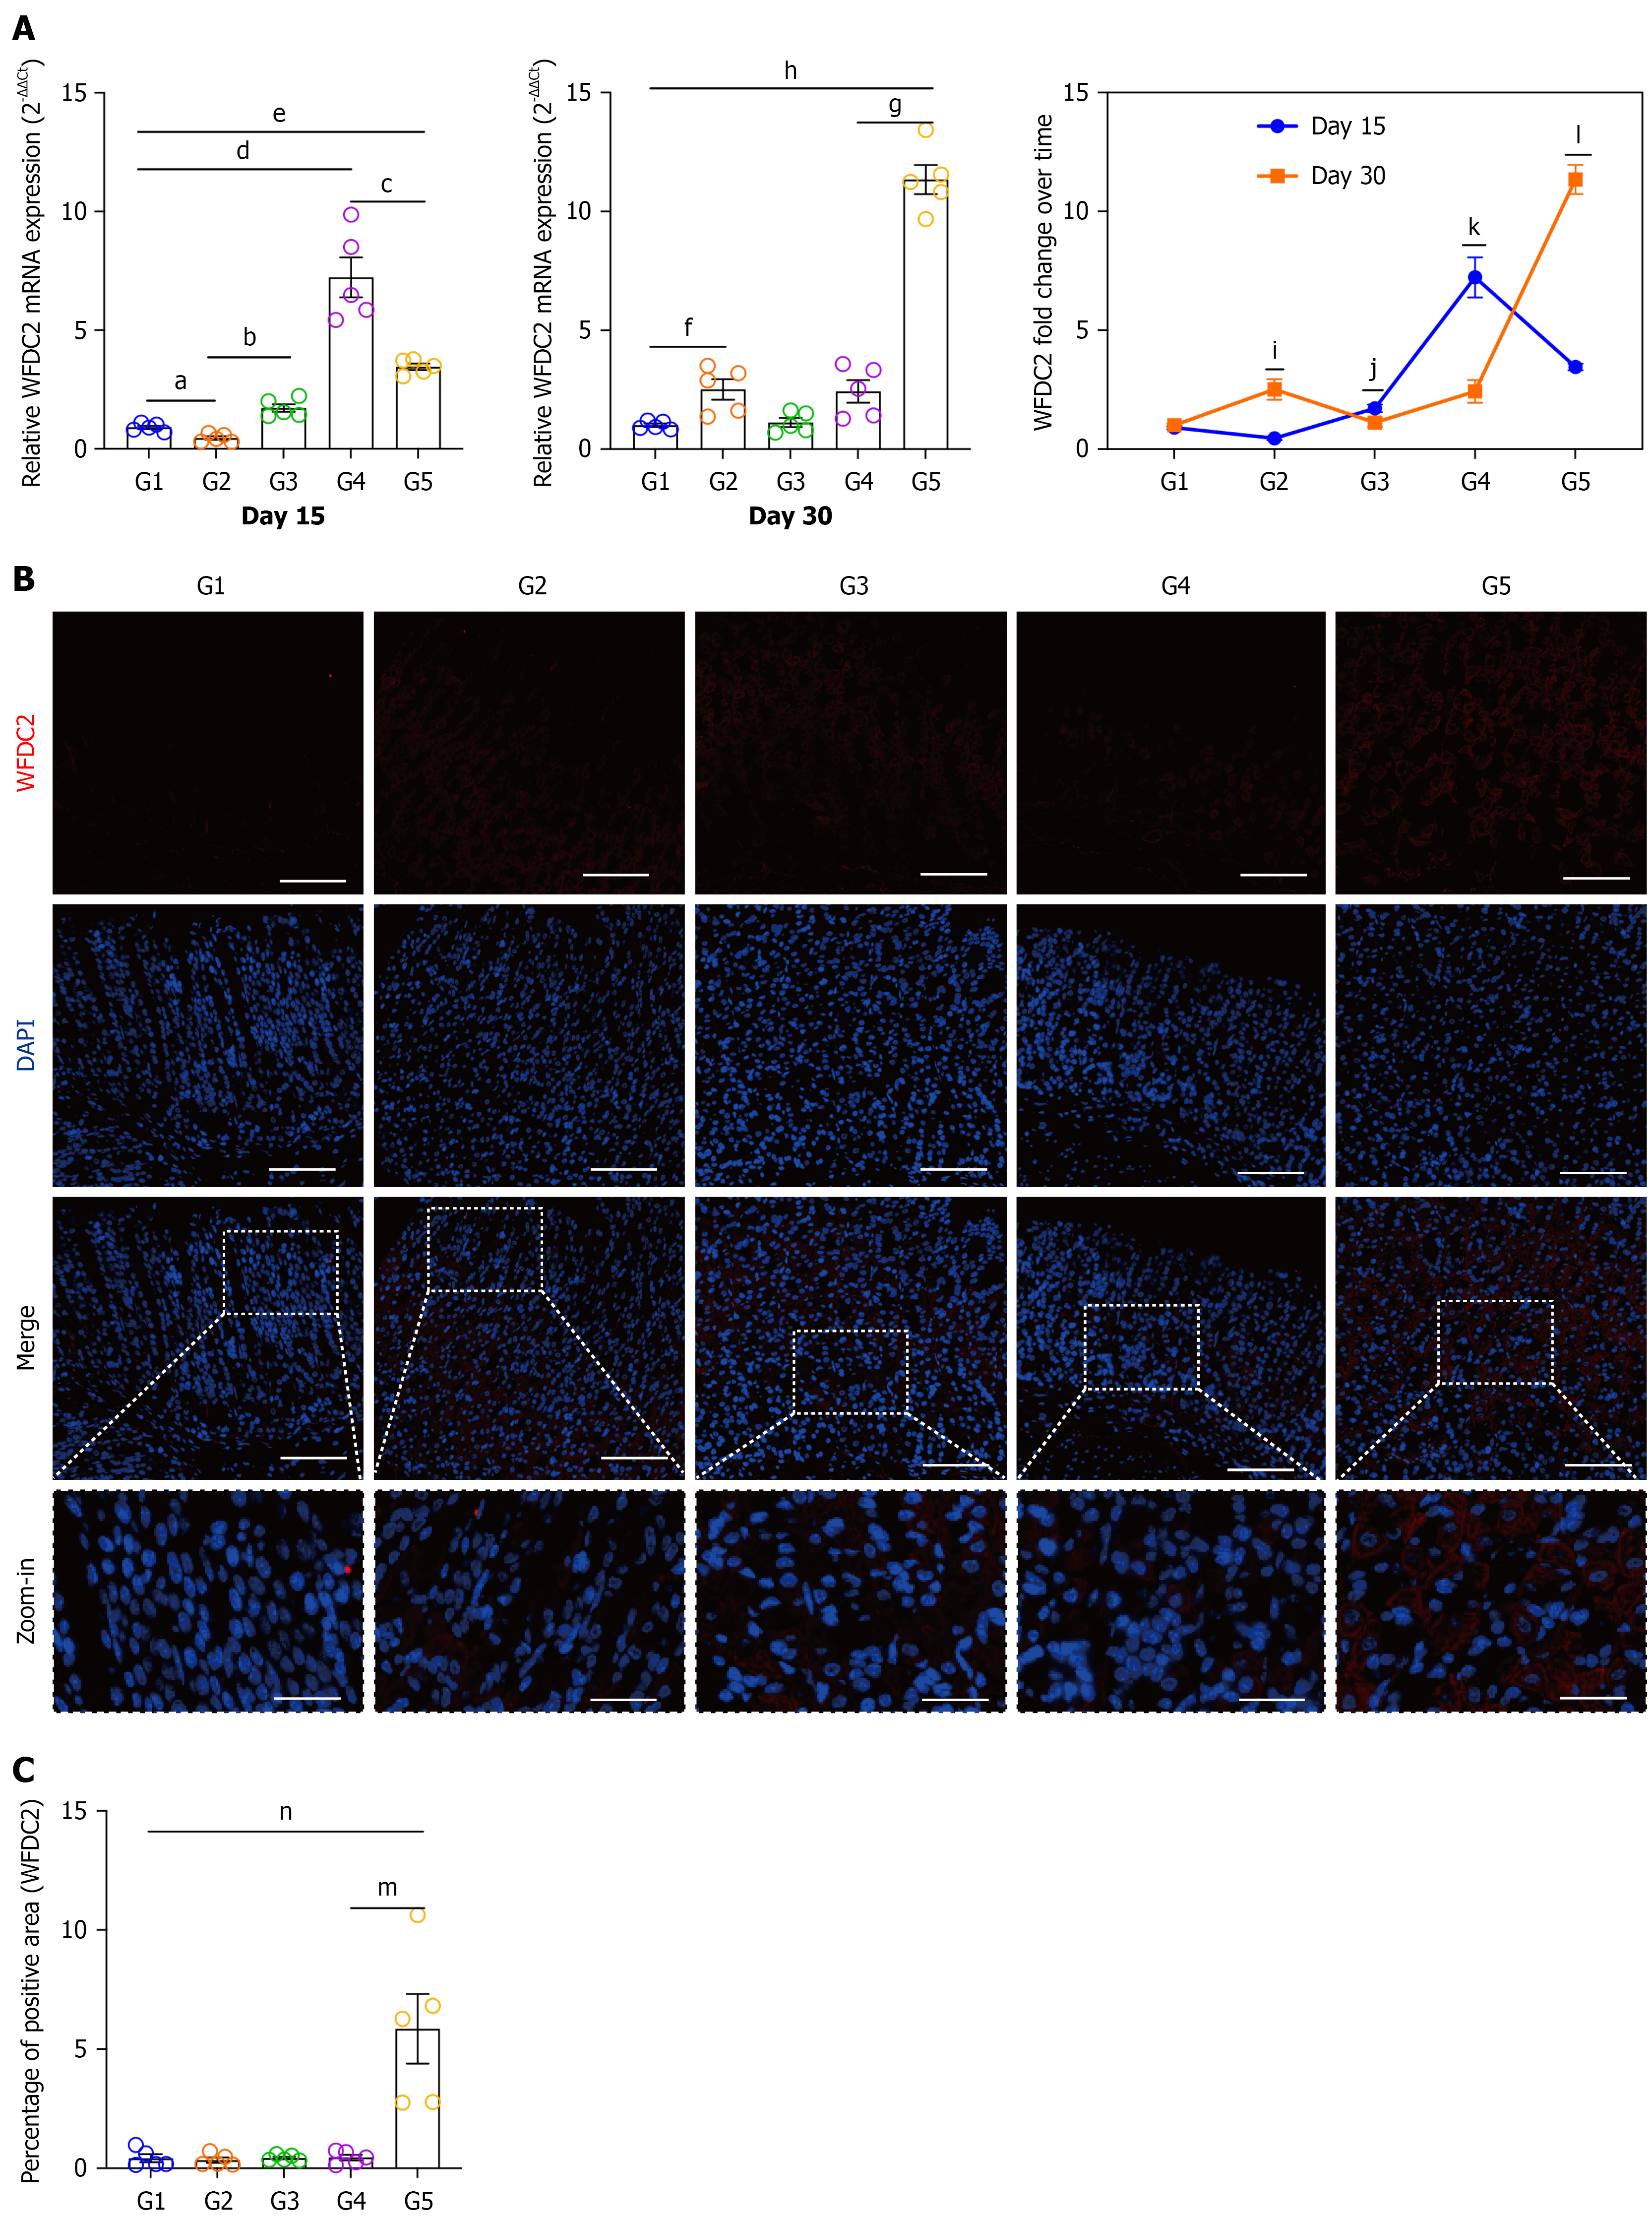
Figure 6 WFDC2 expression in gastric mucosa at days 15 and 30.
A: Relative WFDC2 mRNA expression levels at days 15 and 30 in different experimental groups. At day 15: aP < 0.01 vs G2, bP < 0.0001 vs G3, cP < 0.01 vs G5, dP < 0.0001 vs G4, eP < 0.0001 vs G5. At day 30: fP < 0.001 vs G2, gP < 0.0001 vs G5, hP < 0.0001 vs G5; B: Representative fluorescence in situ hybridization (FISH) images showing WFDC2 expression in gastric mucosa across experimental groups. Scale bar = 100 µm; C: Quantification of WFDC2-positive area (%Area) across experimental groups. mP < 0.001, nP < 0.001 vs G5. Data are presented as mean ± SD (n = 5 per group). Statistical analysis was performed using two-way analysis of variance followed by Tukey’s multiple-comparisons test.
- Citation: Chen WQ, Xu YY, Pan HL, Duan M, Ma H, Li YP, Zhang JW. Yiwei Xiaoyu granules mitigate spasmolytic polypeptide-expressing metaplasia-associated gastric mucosal damage by regulating WFDC2 and the miRNA-7/circRNA network. World J Gastrointest Oncol 2026; 18(7): 118787
- URL: https://www.wjgnet.com/1948-5204/full/v18/i7/118787.htm
- DOI: https://dx.doi.org/10.4251/wjgo.118787