
















Copyright: ©Author(s) 2026.
World J Gastrointest Oncol. Jul 15, 2026; 18(7): 118787
Published online Jul 15, 2026. doi: 10.4251/wjgo.118787
Published online Jul 15, 2026. doi: 10.4251/wjgo.118787
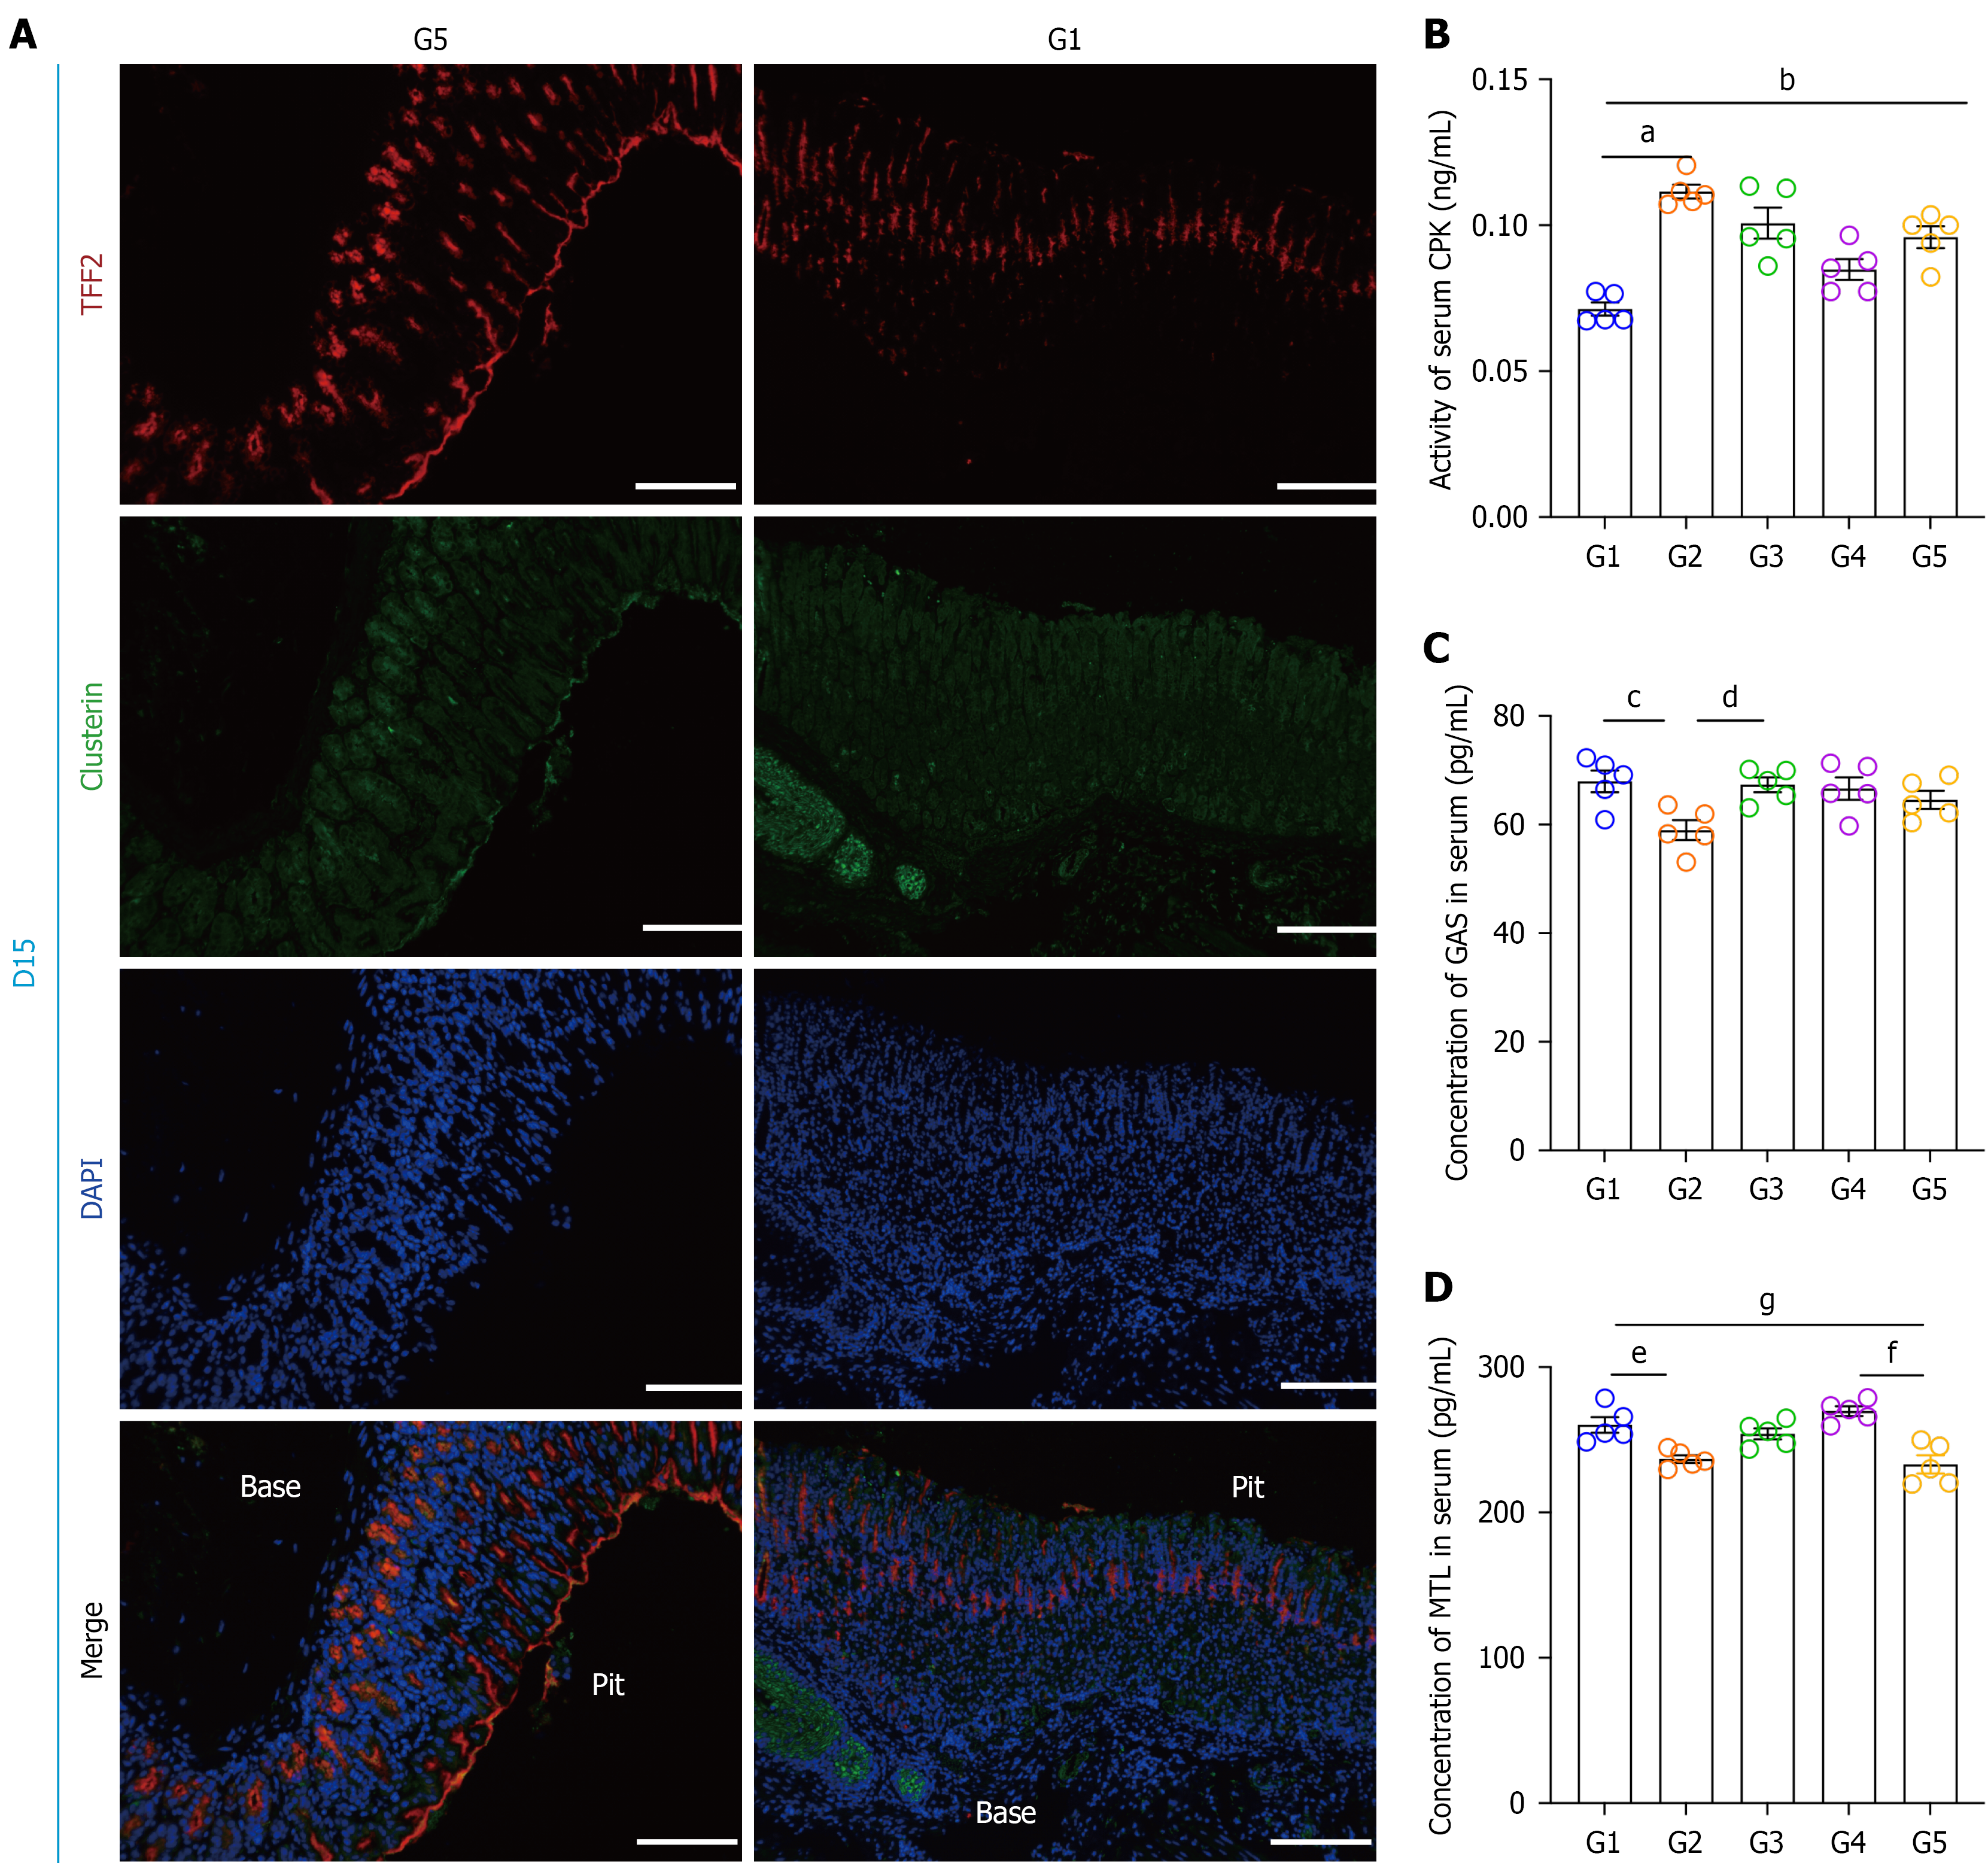
Figure 2 Validation of spasmolytic polypeptide-expressing metaplasia and spleen-stomach deficiency syndrome models through immunofluorescence and ELISA at day 15.
A: Gastric mucosal immunofluorescence showing translocation of TFF2 (red) and clusterin (green) from pit regions to glandular bases in spasmolytic polypeptide-expressing metaplasia + spleen-stomach deficiency syndrome co-induction (G5) vs normal architecture (G1). Nuclei counterstained with 4’, 6-diamidino-2-phenylindole (blue). Scale bar = 200 μm; B: Creatine phosphokinase; C: Gastrin; D: Motilin. aP < 0.0001 vs G2, bP < 0.001 vs G5, cP < 0.05 vs G2, dP < 0.05 vs G3, eP < 0.05 vs G2, fP < 0.001 vs G5, gP < 0.01 vs G5. Data are presented as mean ± SD (n = 5 per group). Statistical analysis was performed using one-way analysis of variance followed by Tukey’s multiple-comparisons test. CPK: Creatine phosphokinase; MTL: Motilin; GAS: Gastrin.
- Citation: Chen WQ, Xu YY, Pan HL, Duan M, Ma H, Li YP, Zhang JW. Yiwei Xiaoyu granules mitigate spasmolytic polypeptide-expressing metaplasia-associated gastric mucosal damage by regulating WFDC2 and the miRNA-7/circRNA network. World J Gastrointest Oncol 2026; 18(7): 118787
- URL: https://www.wjgnet.com/1948-5204/full/v18/i7/118787.htm
- DOI: https://dx.doi.org/10.4251/wjgo.118787