
















Copyright: ©Author(s) 2026.
World J Gastrointest Oncol. Jul 15, 2026; 18(7): 117886
Published online Jul 15, 2026. doi: 10.4251/wjgo.117886
Published online Jul 15, 2026. doi: 10.4251/wjgo.117886
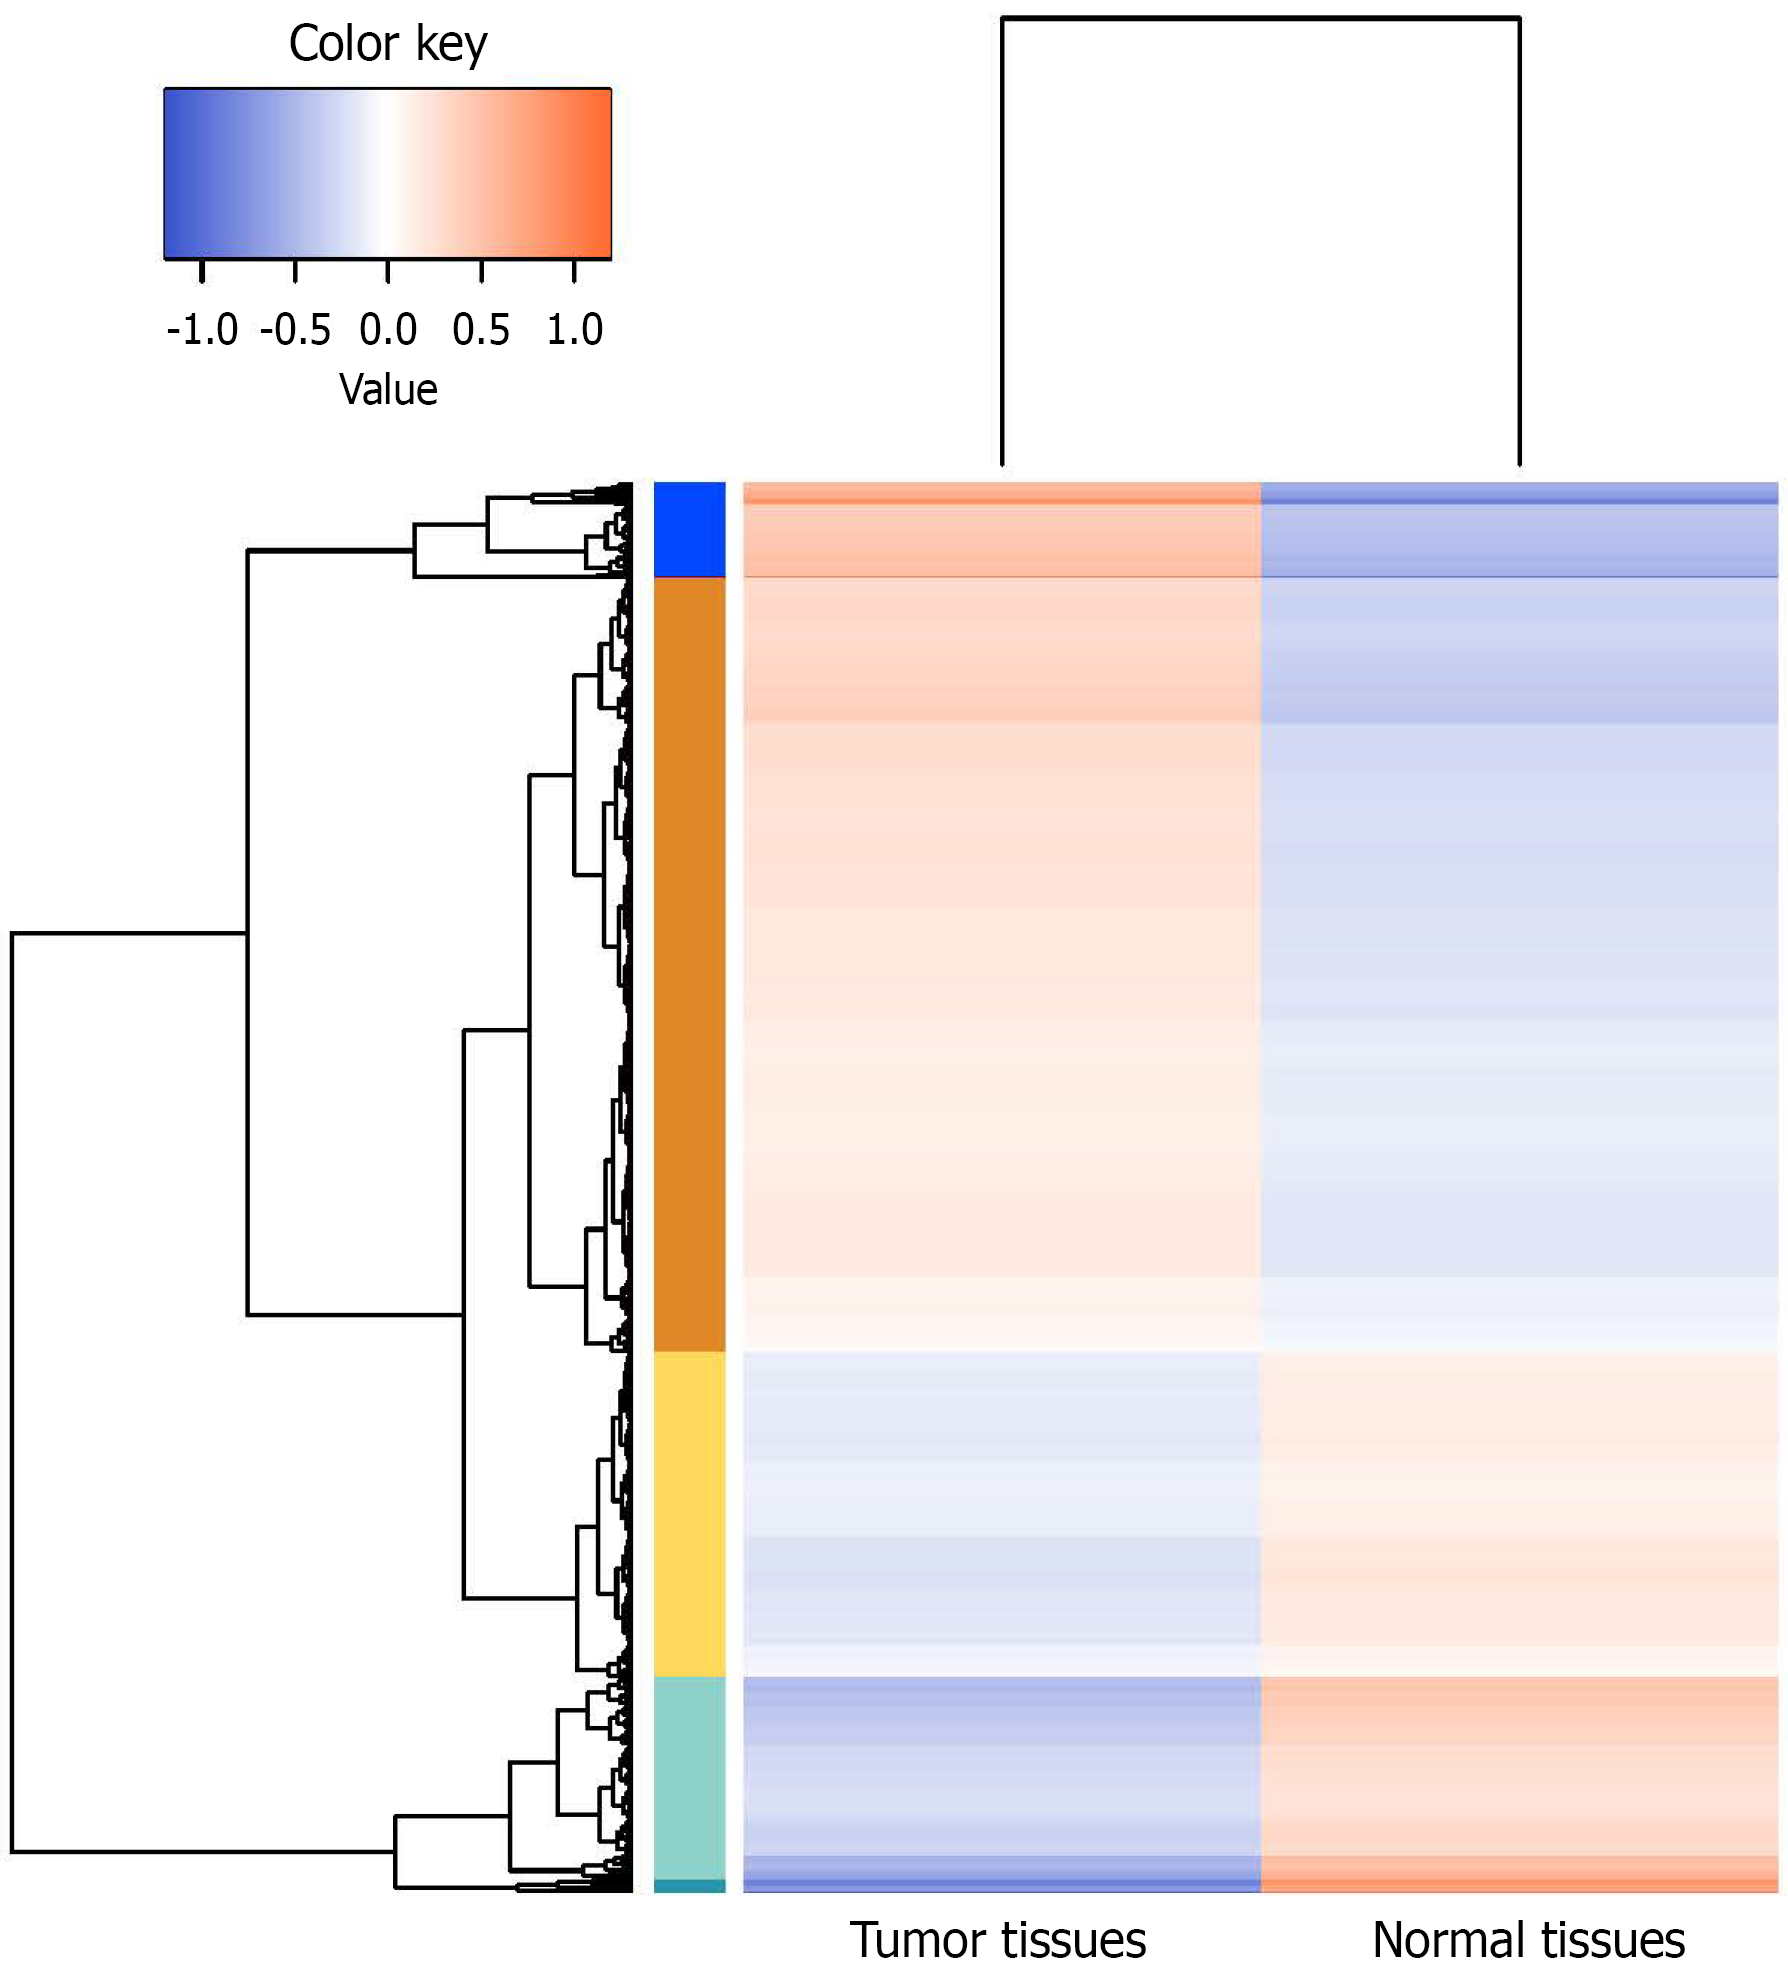
Figure 3 Comprehensive molecular characterization of matched tumor and normal tissue by next-generation sequencing.
Cluster heatmap of differentially expressed genes. Log10 (fragments per kilobase of transcript sequence per million mapped fragments + 1) values were used for hierarchical clustering. Genes with higher expression appear in yellow, whereas lower expression levels are shown in blue.
- Citation: Wen X, Qiu JY, Li J, Mao ZR, Wu WQ. Duodenal signet-ring carcinoma arising in pyloric gland adenoma with RN7SL1/MUC6 upregulation and mitochondrial dysregulation: A case report. World J Gastrointest Oncol 2026; 18(7): 117886
- URL: https://www.wjgnet.com/1948-5204/full/v18/i7/117886.htm
- DOI: https://dx.doi.org/10.4251/wjgo.117886