
















Copyright: ©Author(s) 2026.
World J Gastrointest Oncol. Jun 15, 2026; 18(6): 118678
Published online Jun 15, 2026. doi: 10.4251/wjgo.v18.i6.118678
Published online Jun 15, 2026. doi: 10.4251/wjgo.v18.i6.118678
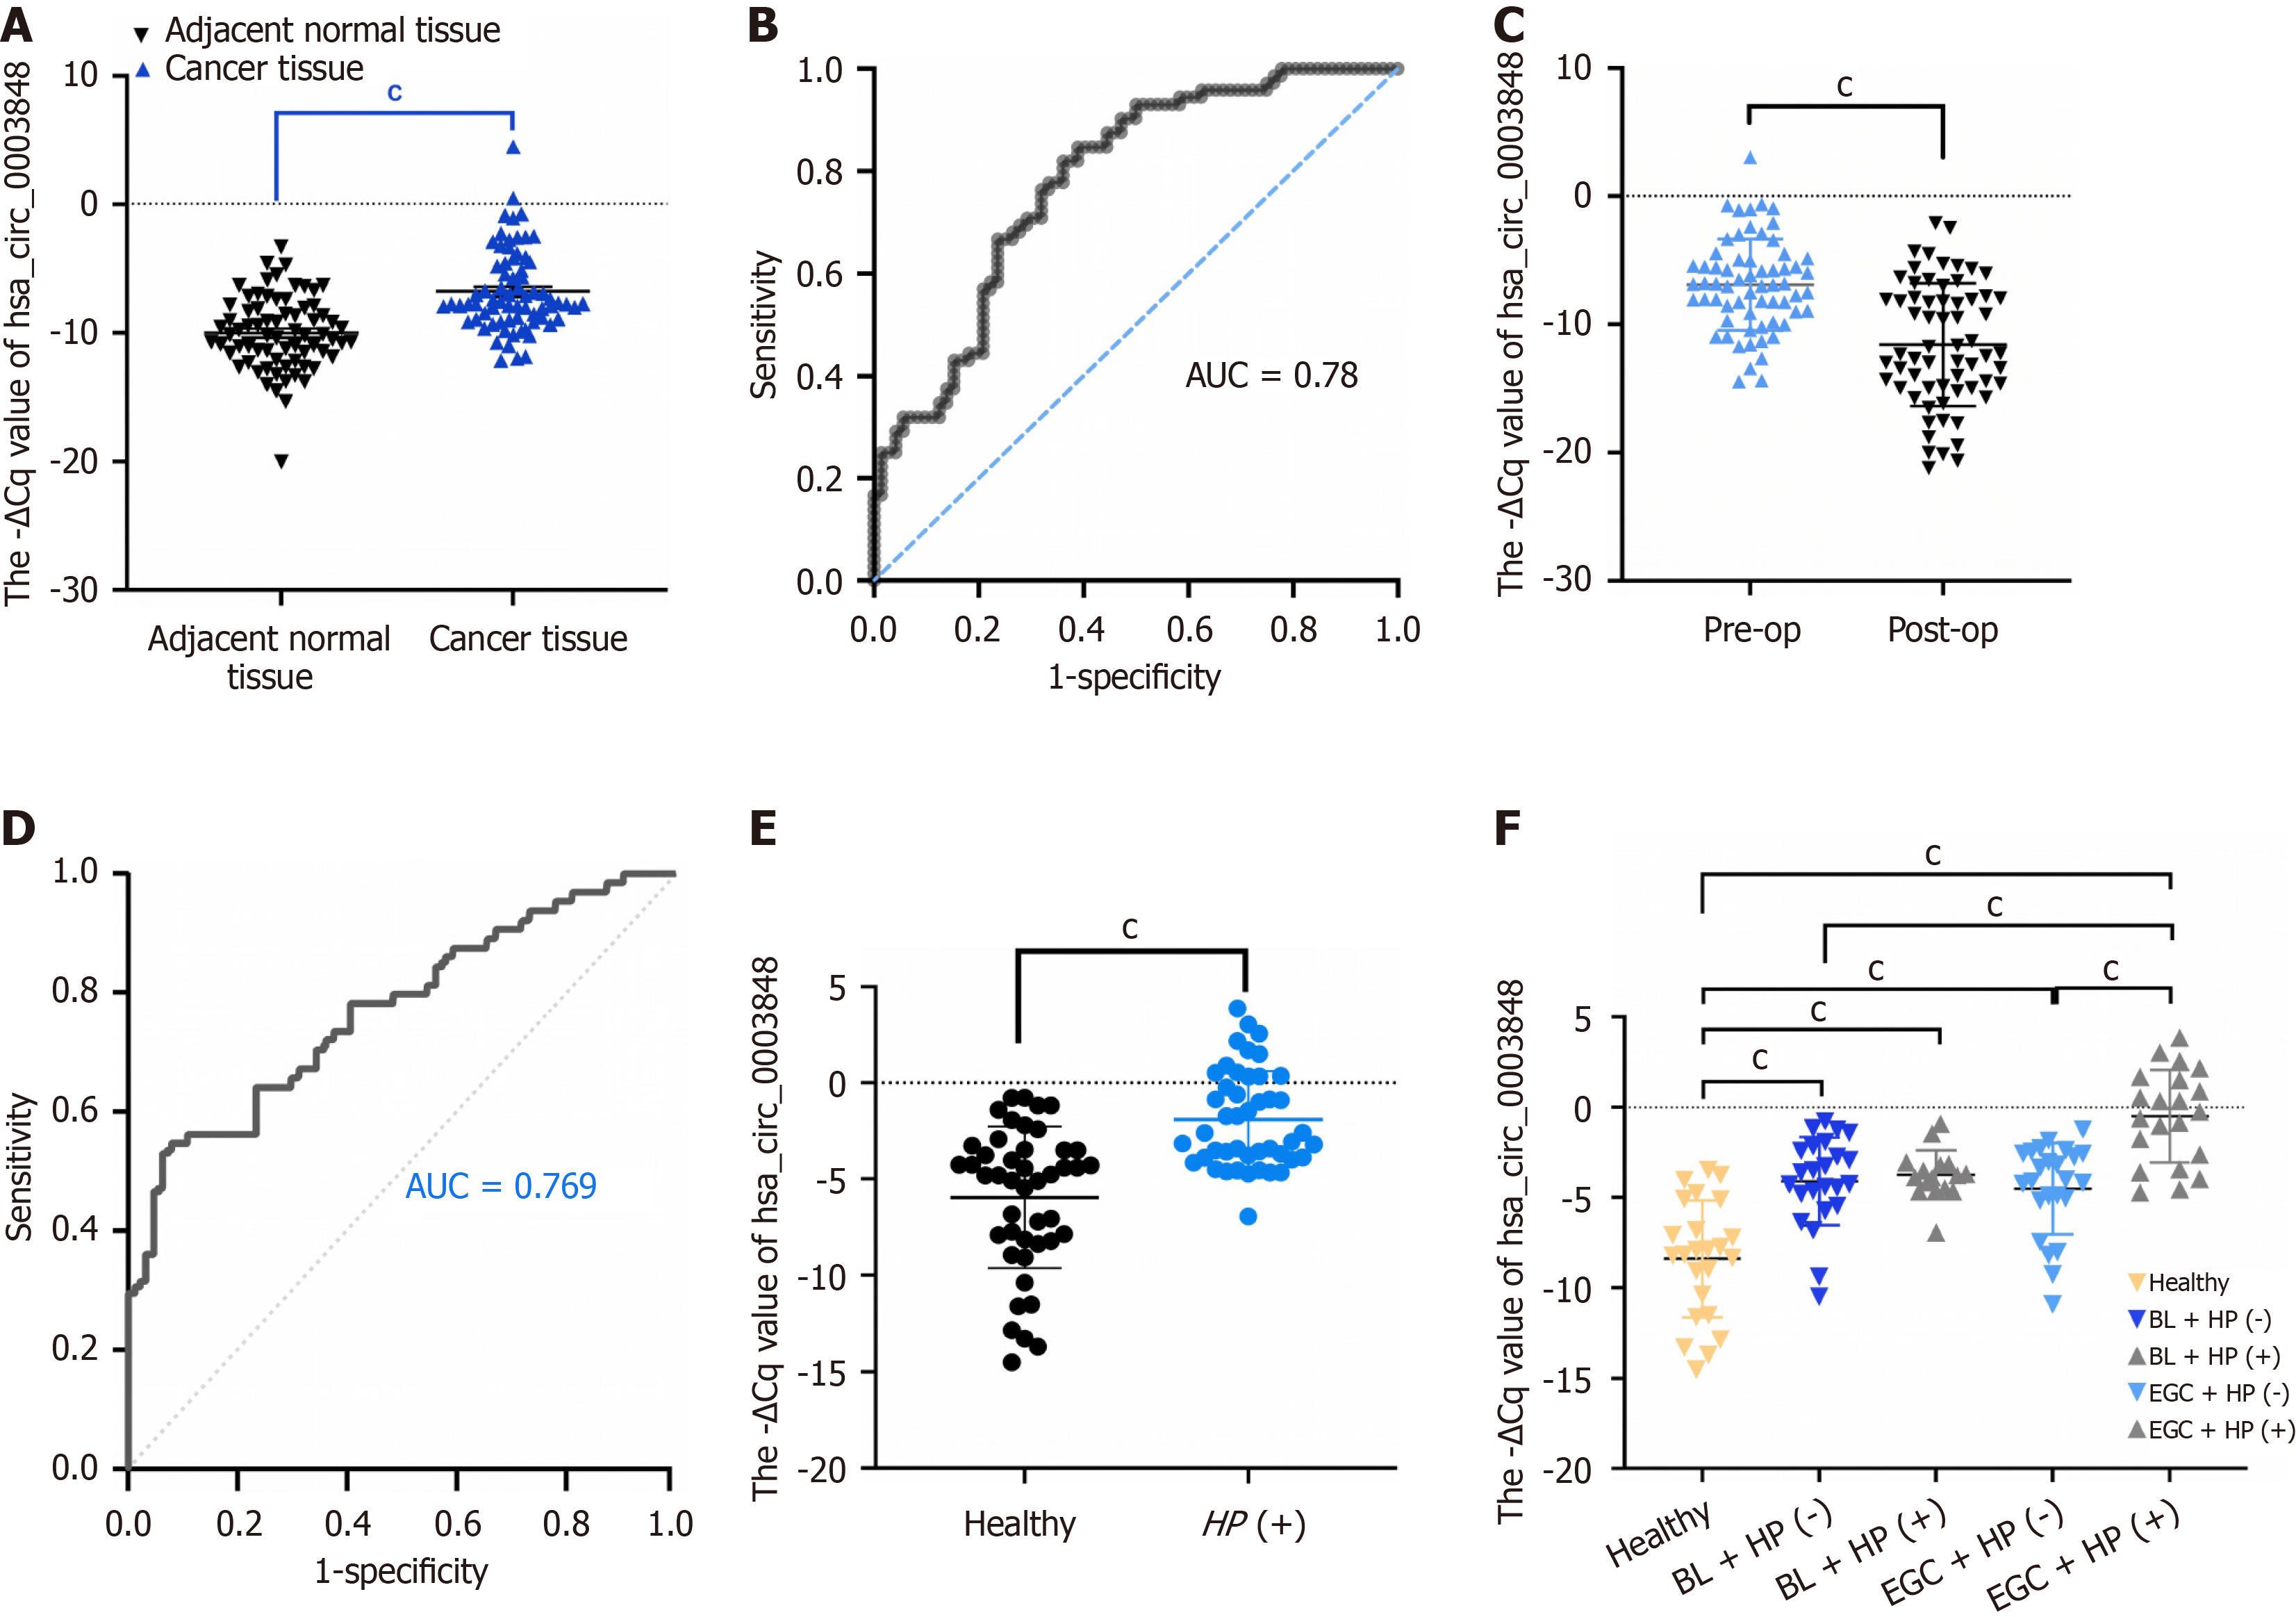
Figure 2 Diagnostic potential of hsa_circ_0003848 in gastric cancer.
A: Comparison of hsa_circ_0003848 expression between gastric cancer (GC) tissues and adjacent normal tissues, n = 72; B: Receiver operating characteristic curve analysis of hsa_circ_0003848 for distinguishing GC tissues from adjacent normal tissues (area under the receiver operating characteristic curve = 0.781); C: Expression levels of hsa_circ_0003848 in plasma samples collected before and 10 days after surgery, n = 72; D: Receiver operating characteristic curve analysis of hsa_circ_0003848 for detecting preoperative and postoperative GC (area under the receiver operating characteristic curve = 0.769); E: Expression of hsa_circ_0003848 in plasma samples from healthy controls and Helicobacter pylori (H. pylori)-infected individuals; F: Expression levels of hsa_circ_0003848 across different groups: Healthy, benign lesions + H. pylori (+), and early gastric cancer + H. pylori (+), showing progressive upregulation in H. pylori-related gastric conditions. Healthy, n = 30; precancerous lesions, n = 60; early GC, n = 60, cP < 0.001. AUC: Area under the receiver operating characteristic curve; BL: Benign lesions; EGC: Early gastric cancer; HP: Helicobacter pylori.
- Citation: Li Z, Zhang B, Hu KF, Cao CL. Hsa_circ_0003848 promotes gastric cancer via miR-144-3p/mesenchymal-epithelial transition factor and serves as a plasma biomarker in Helicobacter pylori infection. World J Gastrointest Oncol 2026; 18(6): 118678
- URL: https://www.wjgnet.com/1948-5204/full/v18/i6/118678.htm
- DOI: https://dx.doi.org/10.4251/wjgo.v18.i6.118678