
















Copyright: ©Author(s) 2026.
World J Gastrointest Oncol. Jun 15, 2026; 18(6): 118121
Published online Jun 15, 2026. doi: 10.4251/wjgo.v18.i6.118121
Published online Jun 15, 2026. doi: 10.4251/wjgo.v18.i6.118121
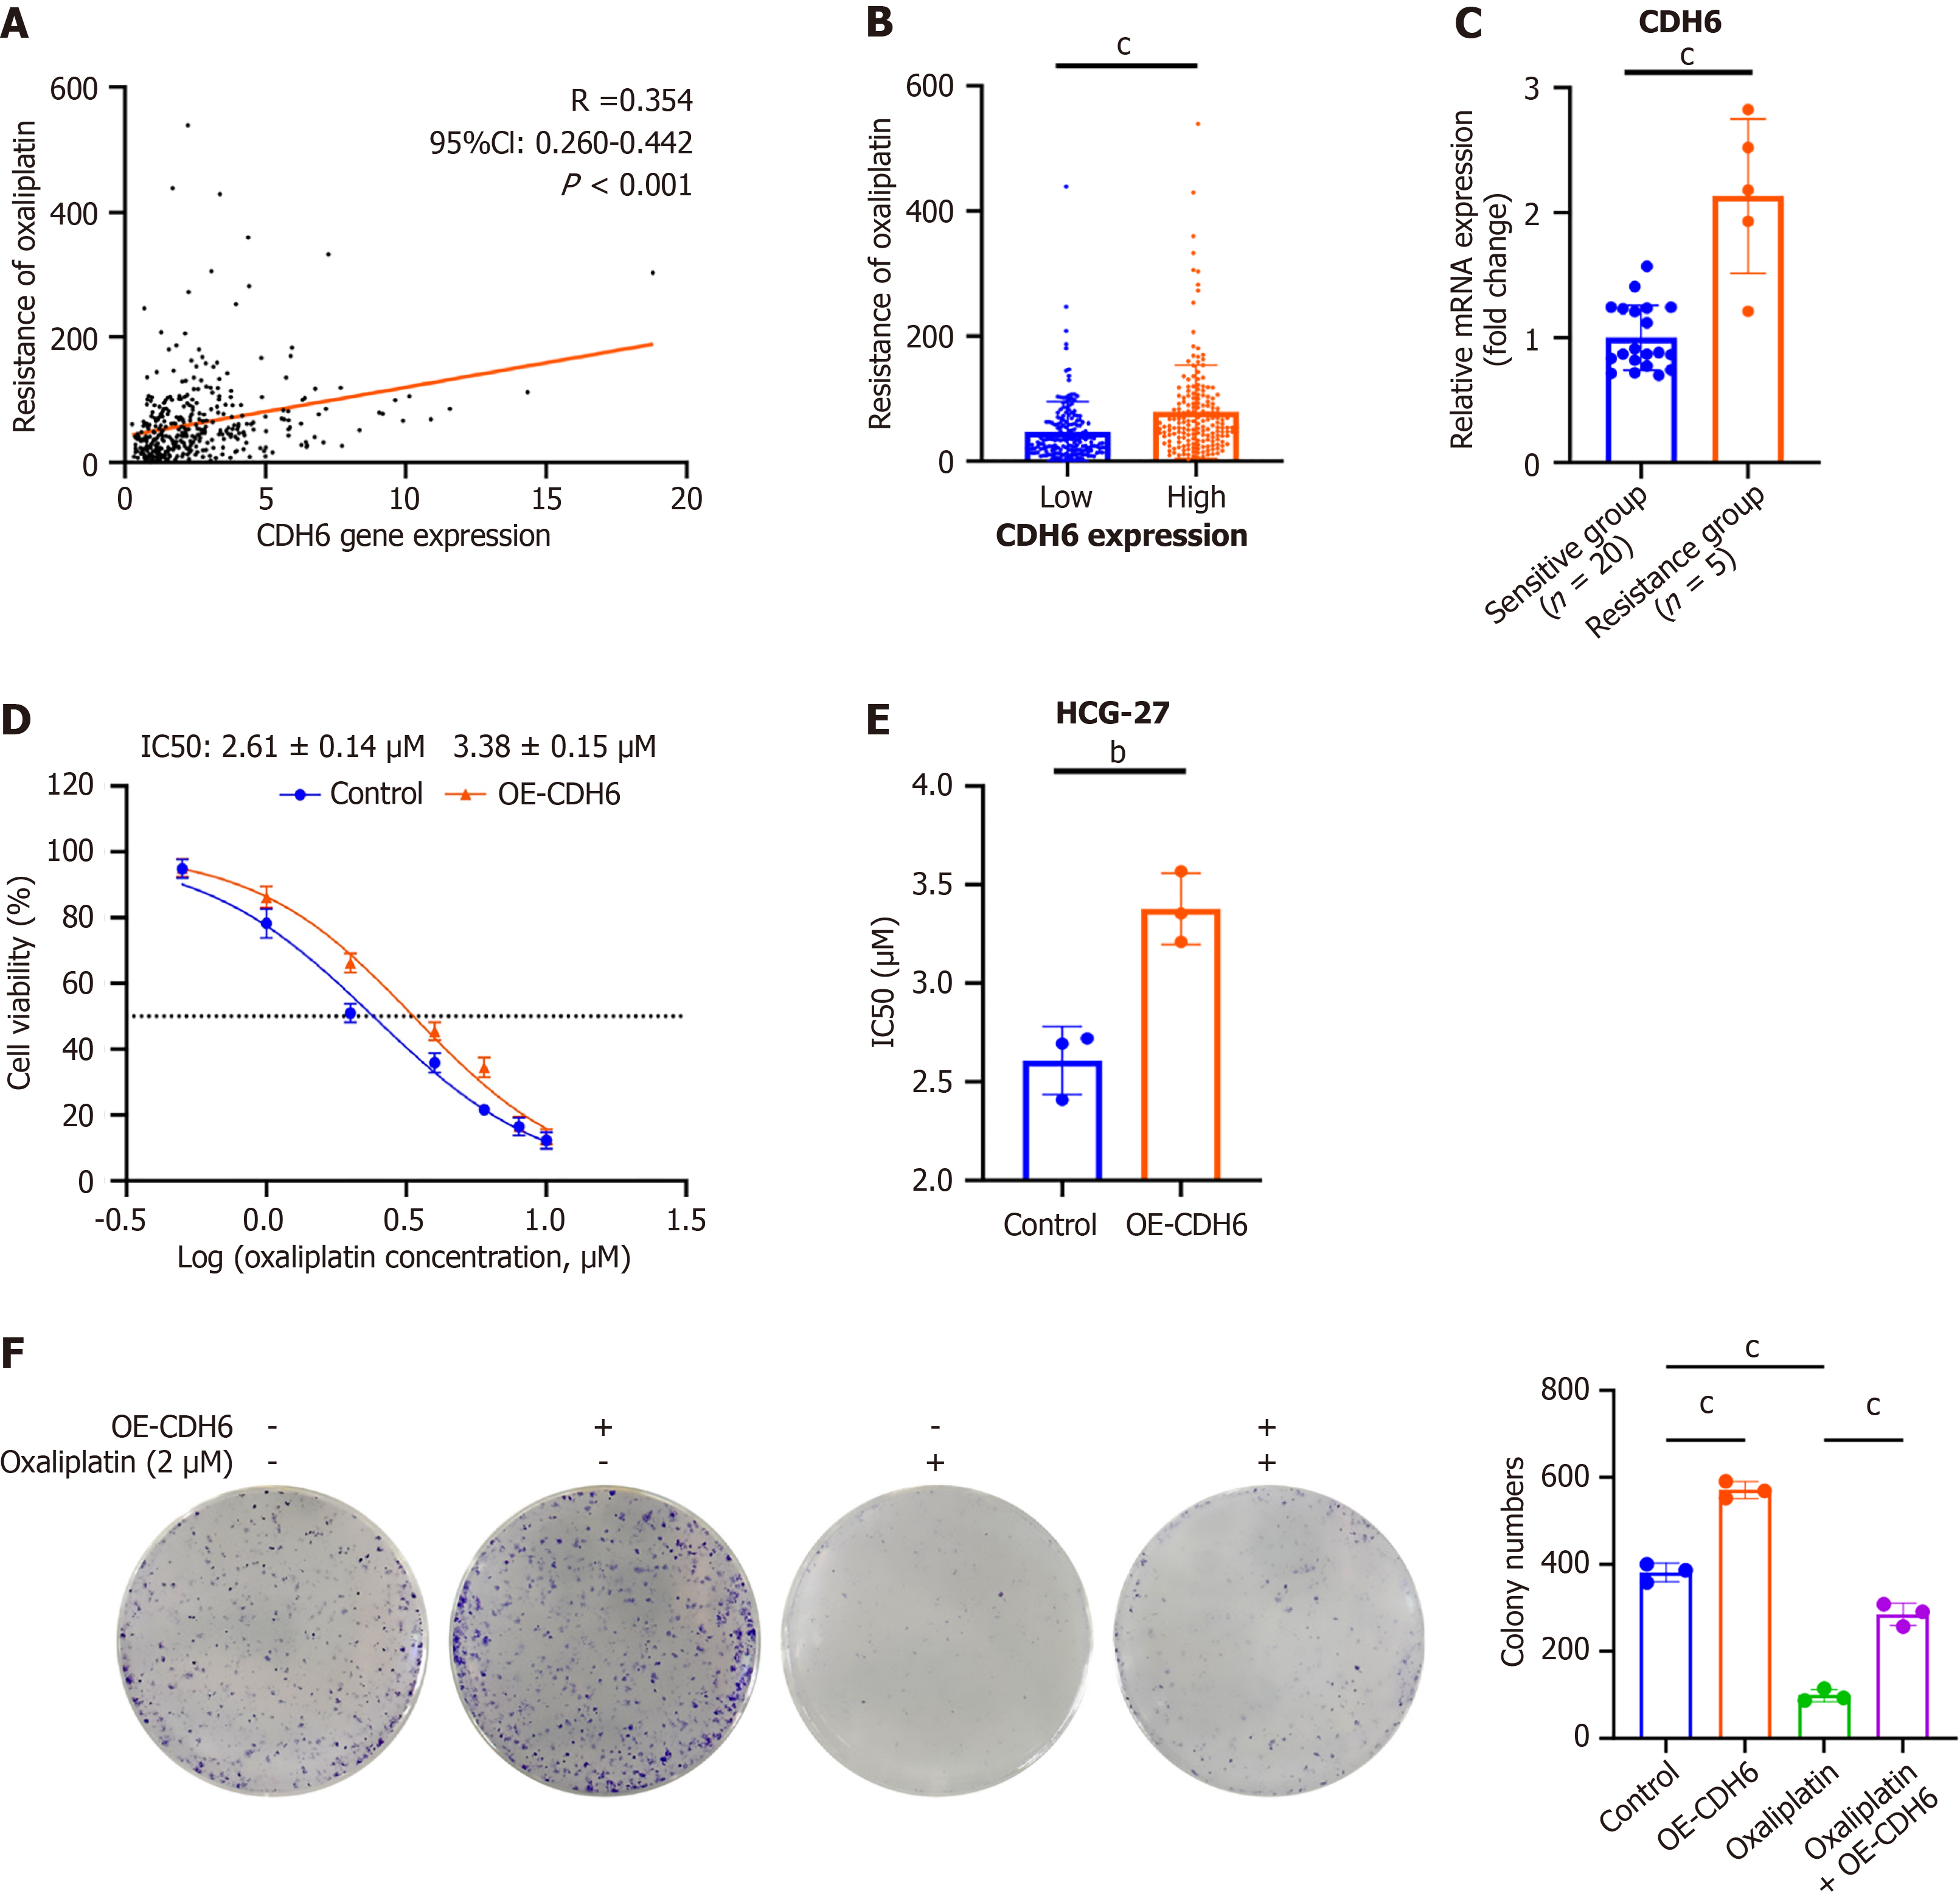
Figure 2 Cadherin 6 promotes oxaliplatin resistance in gastric cancer.
A: Analysis of the correlation between cadherin 6 (CDH6) gene expression and oxaliplatin resistance, indicating that higher CDH6 expression was associated with increased oxaliplatin resistance, r = 0.354, 95% confidence interval: 0.260-0.442 (P < 0.001); B: Comparison of oxaliplatin resistance scores between high and low CDH6 expression groups (P < 0.001); C: Quantitative real-time polymerase chain reaction analysis of CDH6 expression in oxaliplatin-sensitive (n = 20) and oxaliplatin-resistant (n = 5) clinical gastric cancer samples for validation. Sensitive group, mean ± SD: 1.00 ± 0.25; resistance group, mean ± SD: 2.14 ± 0.55 (P < 0.001); D: Oxaliplatin dose-response curves for control and CDH6-overexpression (OE-CDH6) groups. Control group, R2 = 0.983, mean ± SD: 2.61 ± 0.14 μM; OE-CDH6 groups, R2 = 0.984, mean ± SD: 3.38 ± 0.15 μM; E: Half-maximal inhibitory concentration values calculated from dose-response curves for OE-CDH6 and control groups (P < 0.01); F: Colony formation assay results; following oxaliplatin (2 μM) treatment, the OE-CDH6 group formed more colonies than the control group, P < 0.0001. bP < 0.01, cP < 0.001. CDH6: Cadherin 6; CI: Confidence interval; IC50: Half-maximal inhibitory concentration; OE-CDH6: Cadherin 6-overexpression.
- Citation: Zhao ZX, Liu QL, Fan JX, Zhu S, Wang FS, Hu ZJ. Cadherin 6 drives epithelial-mesenchymal transition and oxaliplatin resistance in gastric cancer via transforming growth factor-β/Smad signaling axis. World J Gastrointest Oncol 2026; 18(6): 118121
- URL: https://www.wjgnet.com/1948-5204/full/v18/i6/118121.htm
- DOI: https://dx.doi.org/10.4251/wjgo.v18.i6.118121