
















Copyright: ©Author(s) 2026.
World J Gastrointest Oncol. Jun 15, 2026; 18(6): 117851
Published online Jun 15, 2026. doi: 10.4251/wjgo.v18.i6.117851
Published online Jun 15, 2026. doi: 10.4251/wjgo.v18.i6.117851
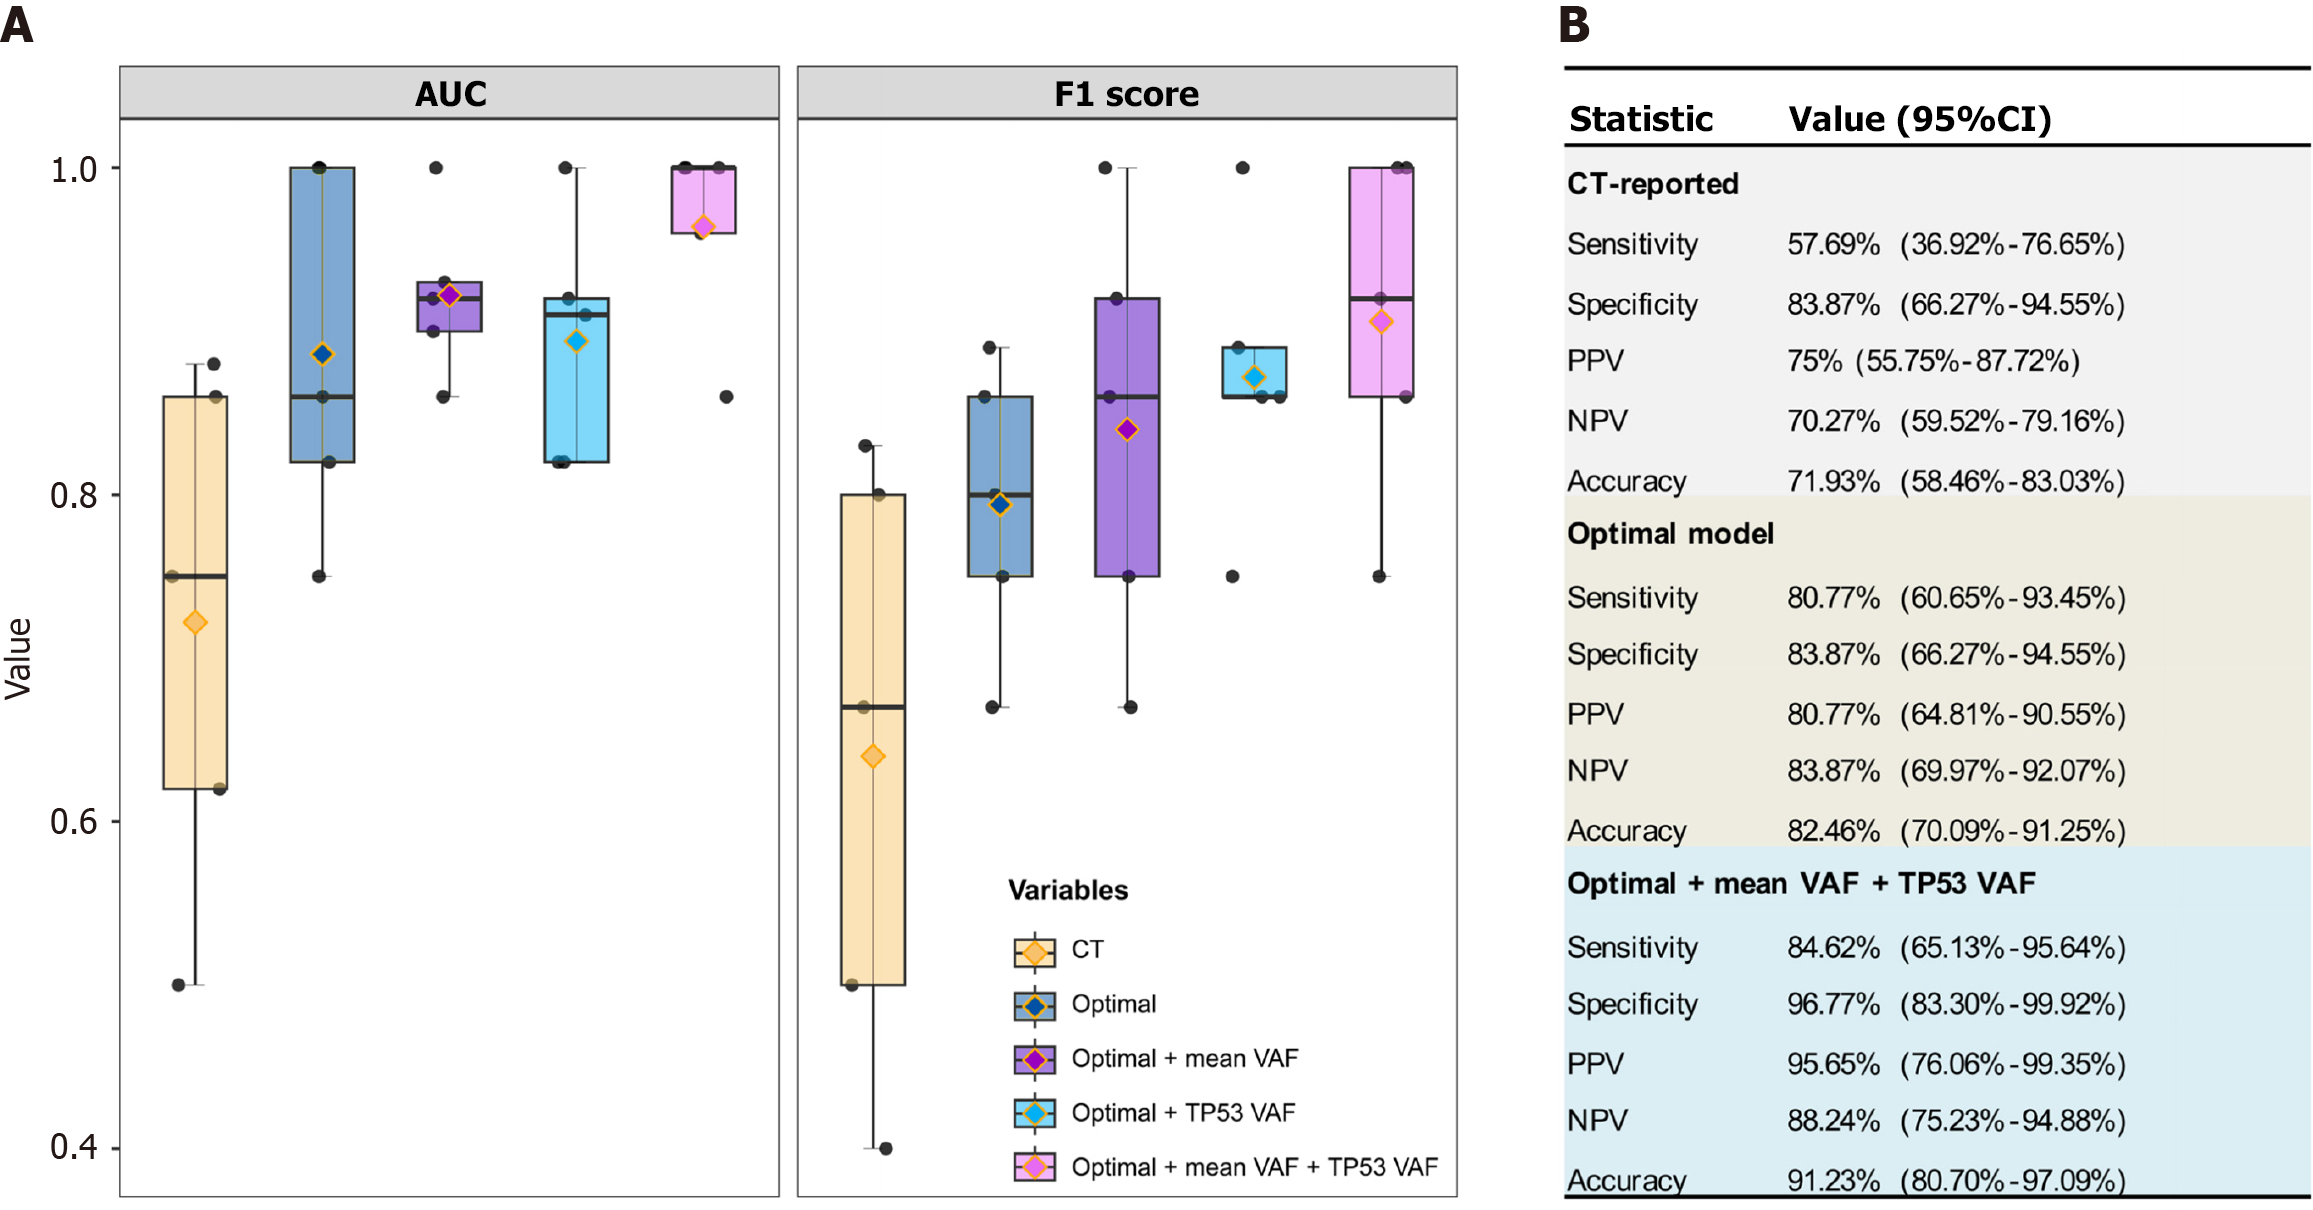
Figure 5 Performance comparison among different random forest models with or without circulating tumor DNA features.
A: Area under the curve and F1 score of the circulating tumor DNA cohort. It compares the area under the curve and F1 score of different model combinations in the circulating tumor DNA cohort; B: Performance capacity of three machine-learning models. It details the performance metrics of three selected machine-learning models. AUC: Area under the curve; CT: Computed tomography; PPV: Positive predictive value; NPV: Negative predictive value; VAF: Variant allele frequency.
- Citation: Gu RT, Li X, Cheng W, Wang XW, Jin H, Liu T. Machine-learning models integrating preoperative clinical factors and circulating tumor DNA features predict lymph node metastasis in esophageal carcinoma. World J Gastrointest Oncol 2026; 18(6): 117851
- URL: https://www.wjgnet.com/1948-5204/full/v18/i6/117851.htm
- DOI: https://dx.doi.org/10.4251/wjgo.v18.i6.117851