
















Copyright: ©Author(s) 2026.
World J Gastrointest Oncol. Jun 15, 2026; 18(6): 117851
Published online Jun 15, 2026. doi: 10.4251/wjgo.v18.i6.117851
Published online Jun 15, 2026. doi: 10.4251/wjgo.v18.i6.117851
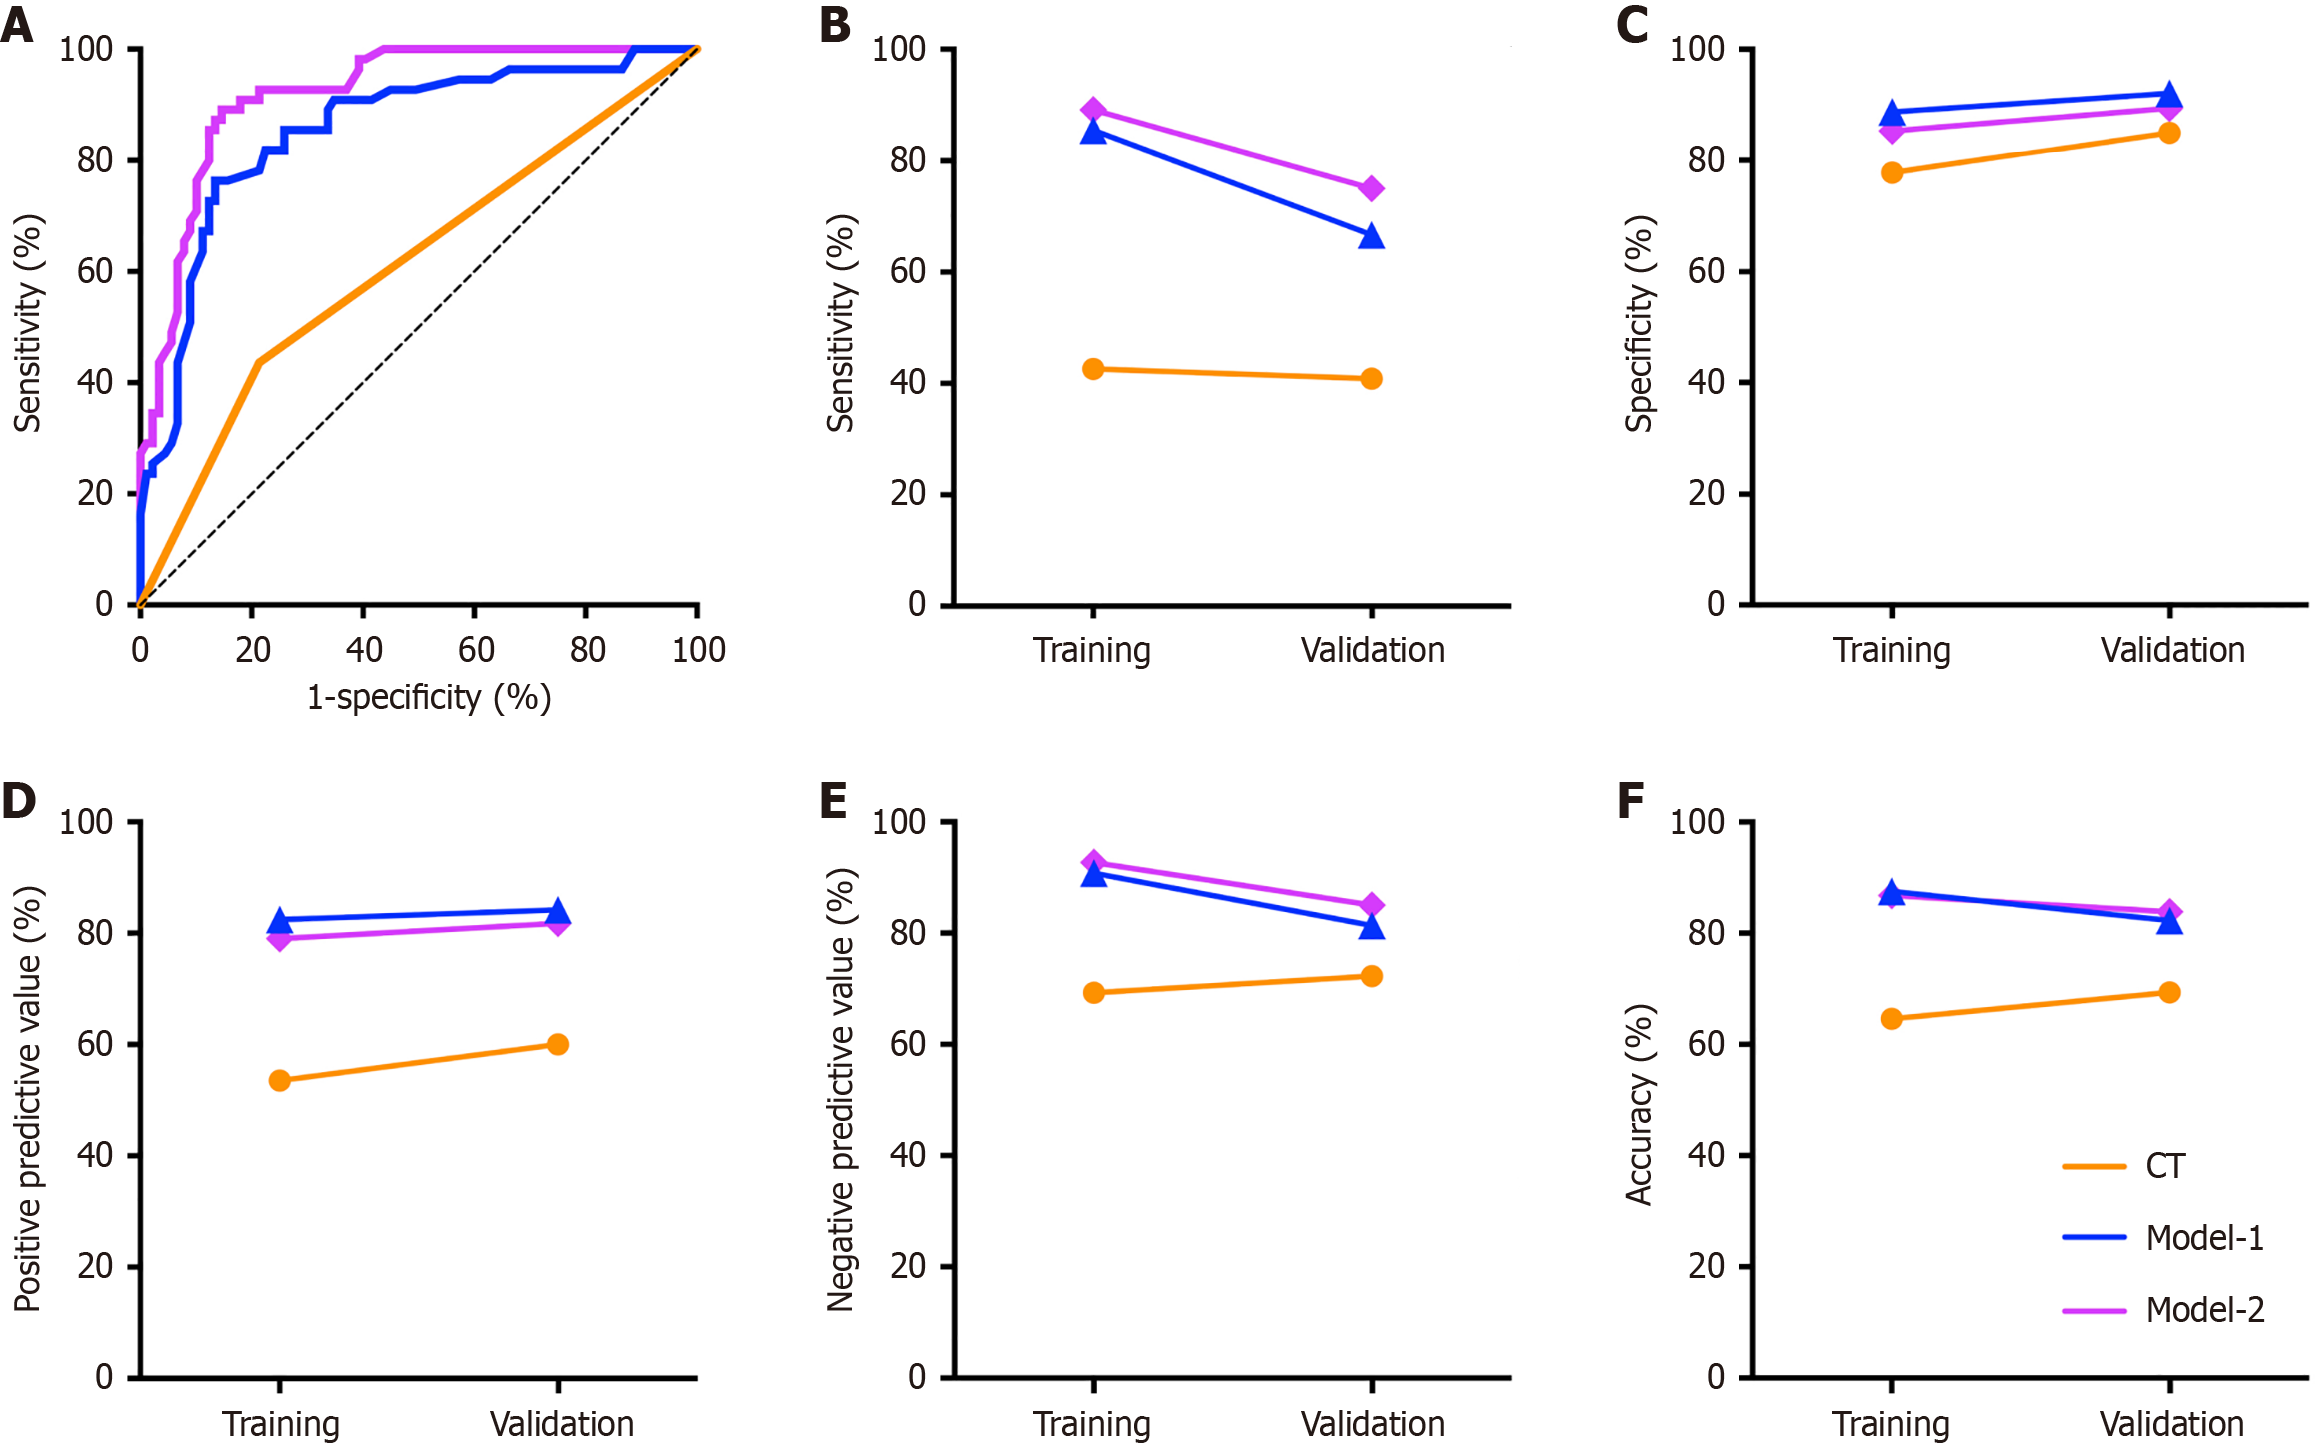
Figure 3 Performance comparison between machine-learning models and computed tomography in evaluating lymph node metastasis status in esophageal cancer patients.
A: The receiver operating characteristic curves in the training cohort, where lines of different colors represent different models or computed tomography (CT); B-F: The sensitivity, specificity, positive predictive value, negative predictive value and accuracy of the training and validation sets. Model-1 with the highest area under the curve in the training set, developed by the random forest algorithm, included five factors: (1) Tumor location; (2) Depth of tumor invasion; (3) Tumor length; (4) CT reported results; and (5) Number of abnormal protein biomarkers. Model-2 with the best F1 score in the training cohort, established by naïve Bayes algorithm, contained four variables: (1) Tumor location; (2) Depth of tumor invasion; (3) Tumor length; and (4) CT results.
- Citation: Gu RT, Li X, Cheng W, Wang XW, Jin H, Liu T. Machine-learning models integrating preoperative clinical factors and circulating tumor DNA features predict lymph node metastasis in esophageal carcinoma. World J Gastrointest Oncol 2026; 18(6): 117851
- URL: https://www.wjgnet.com/1948-5204/full/v18/i6/117851.htm
- DOI: https://dx.doi.org/10.4251/wjgo.v18.i6.117851