
















Copyright: ©Author(s) 2026.
World J Gastrointest Oncol. Jun 15, 2026; 18(6): 117697
Published online Jun 15, 2026. doi: 10.4251/wjgo.v18.i6.117697
Published online Jun 15, 2026. doi: 10.4251/wjgo.v18.i6.117697
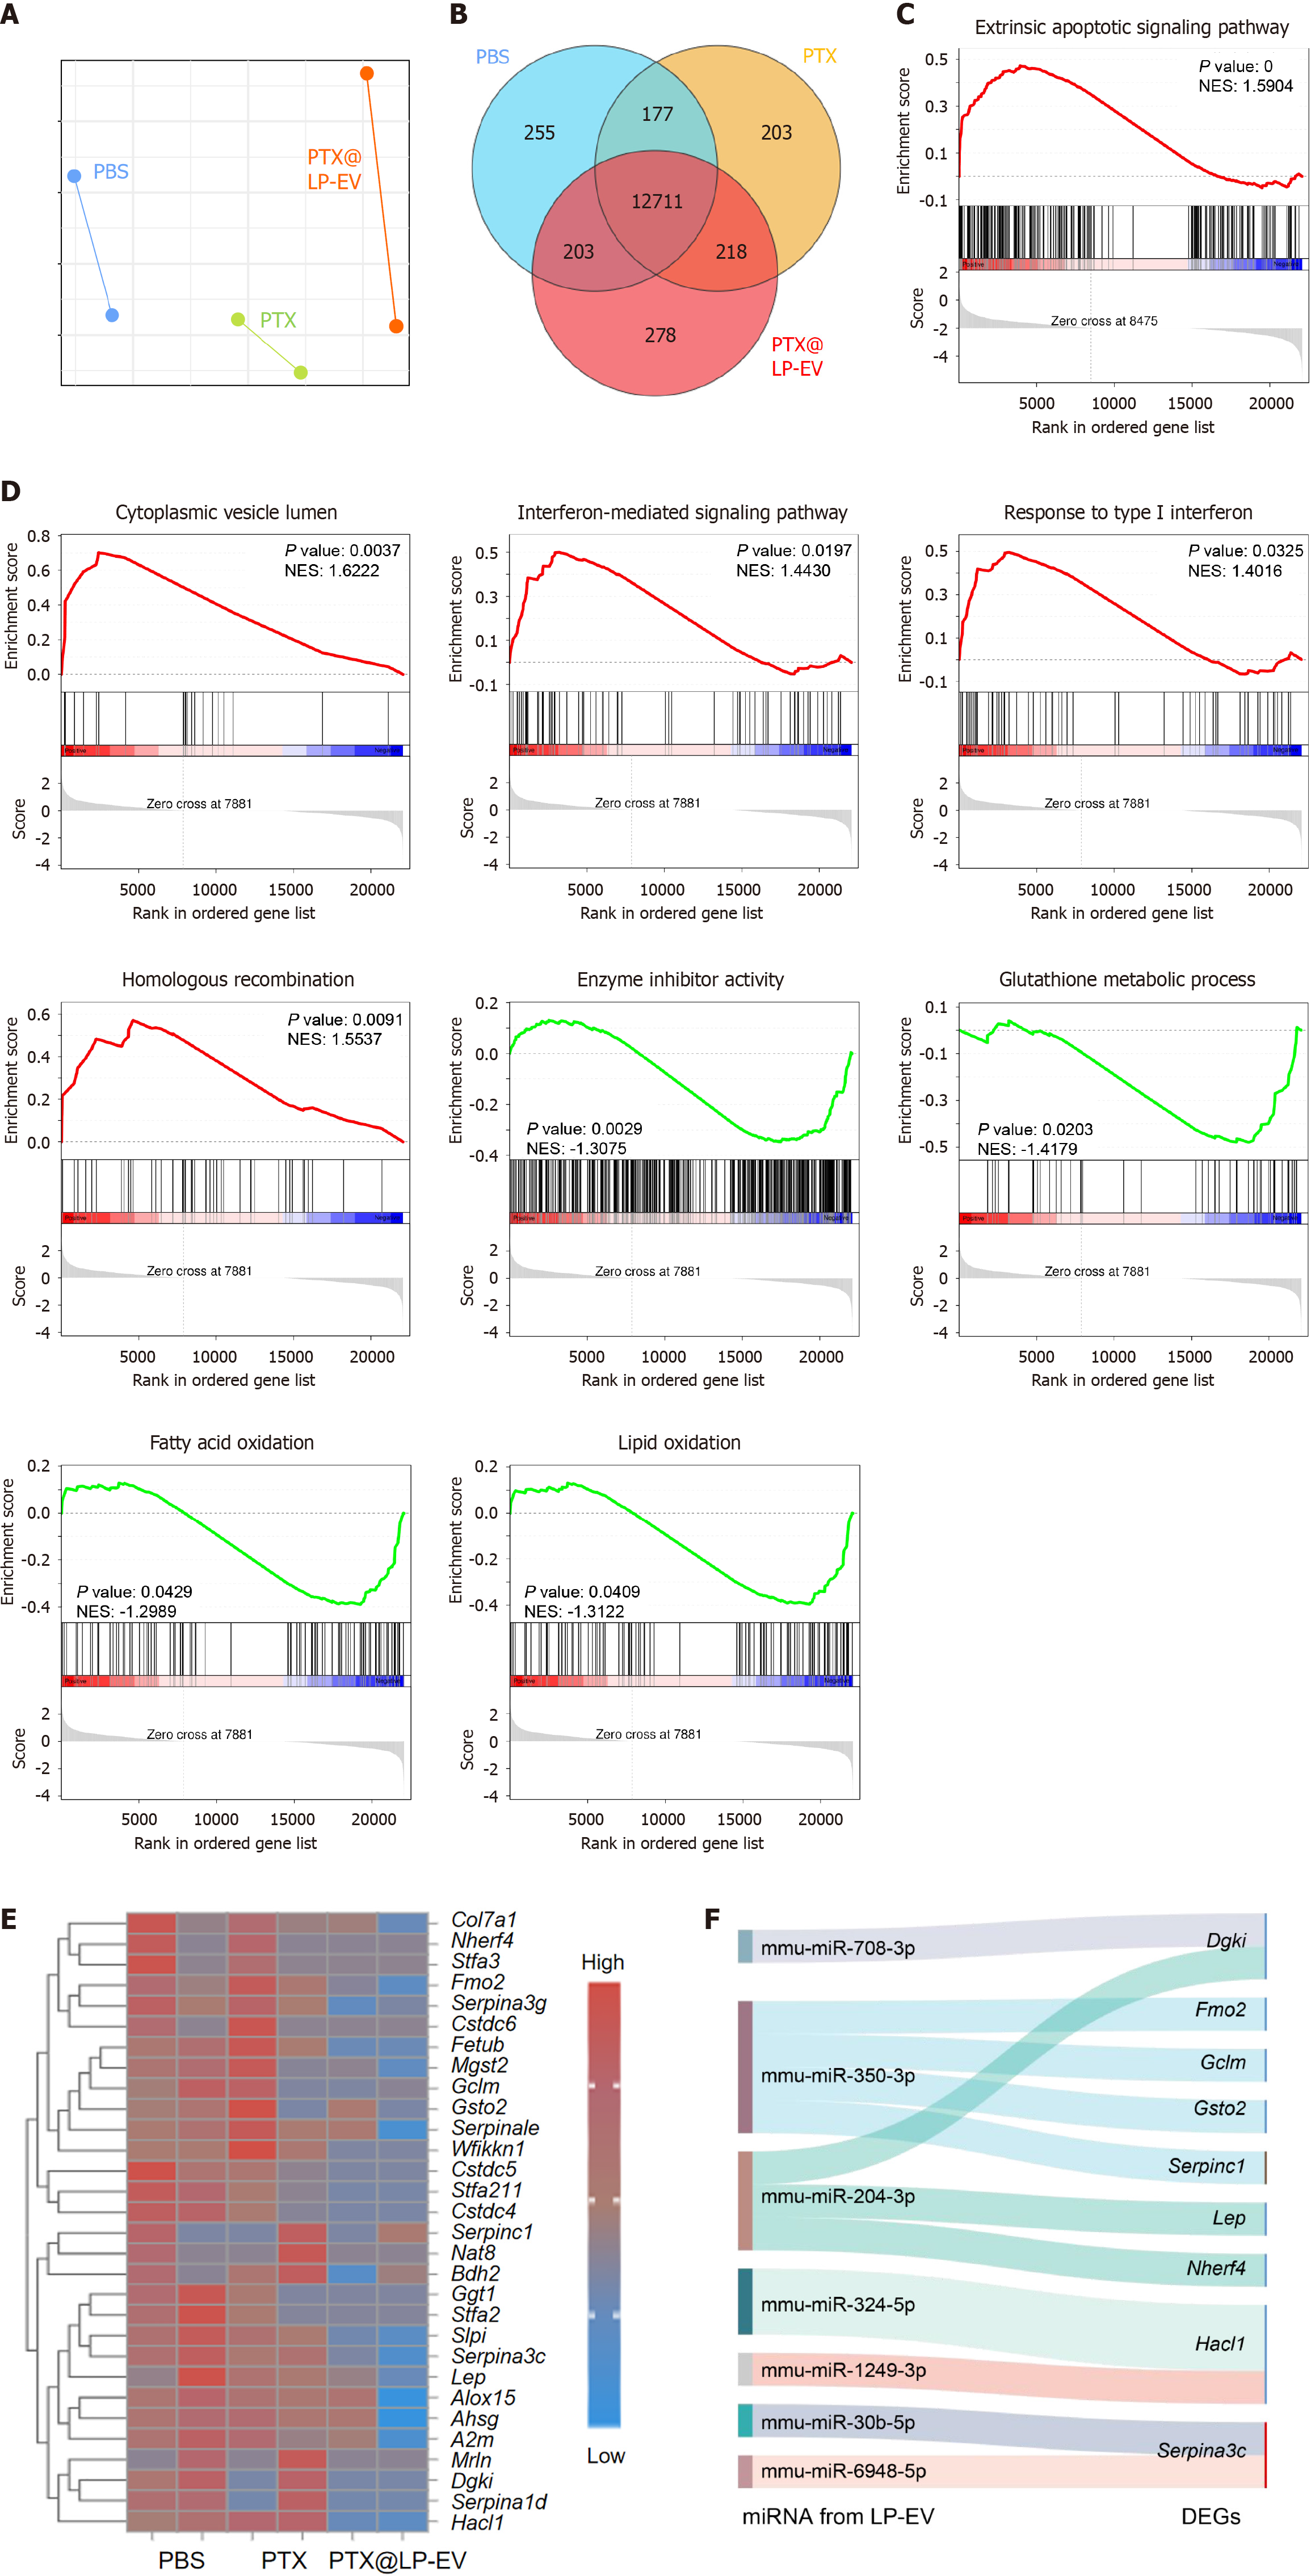
Figure 6 Transcriptomic analysis of the enhanced anti-tumor mechanism of PTX@LP-EV.
A: Principal component analysis plot of RNA-seq data from tumor tissues treated with PBS, free paclitaxel (PTX), or PTX@LP-EV; B: Venn diagram showing the overlap of differentially expressed genes (|log2 fold change| > 1, P < 0.05) between the indicated comparison groups; C: Gene Set Enrichment Analysis (GSEA) plot for the comparison of free PTX vs PBS; D: GSEA plots for the comparison of PTX@LP-EV vs free PTX; E: Heatmap showing the expression levels of selected genes across the three treatment groups; F: Sankey diagram illustrating potential regulatory connections between upregulated miRNAs in LP-EV (vs control extracellular vesicles) and downregulated genes in tumors treated with PTX@LP-EV (vs free PTX). LP-EV: Low-pH preconditioned macrophage-derived extracellular vesicle; PTX: Paclitaxel.
- Citation: Wang JH, Hu ML, Shi M, Ma JL, Yang J, Wang YG. Low-pH preconditioned macrophage-derived extracellular vesicles enable targeted and enhanced paclitaxel therapy in gastric cancer. World J Gastrointest Oncol 2026; 18(6): 117697
- URL: https://www.wjgnet.com/1948-5204/full/v18/i6/117697.htm
- DOI: https://dx.doi.org/10.4251/wjgo.v18.i6.117697