
















Copyright: ©Author(s) 2026.
World J Gastrointest Oncol. Jun 15, 2026; 18(6): 117694
Published online Jun 15, 2026. doi: 10.4251/wjgo.v18.i6.117694
Published online Jun 15, 2026. doi: 10.4251/wjgo.v18.i6.117694
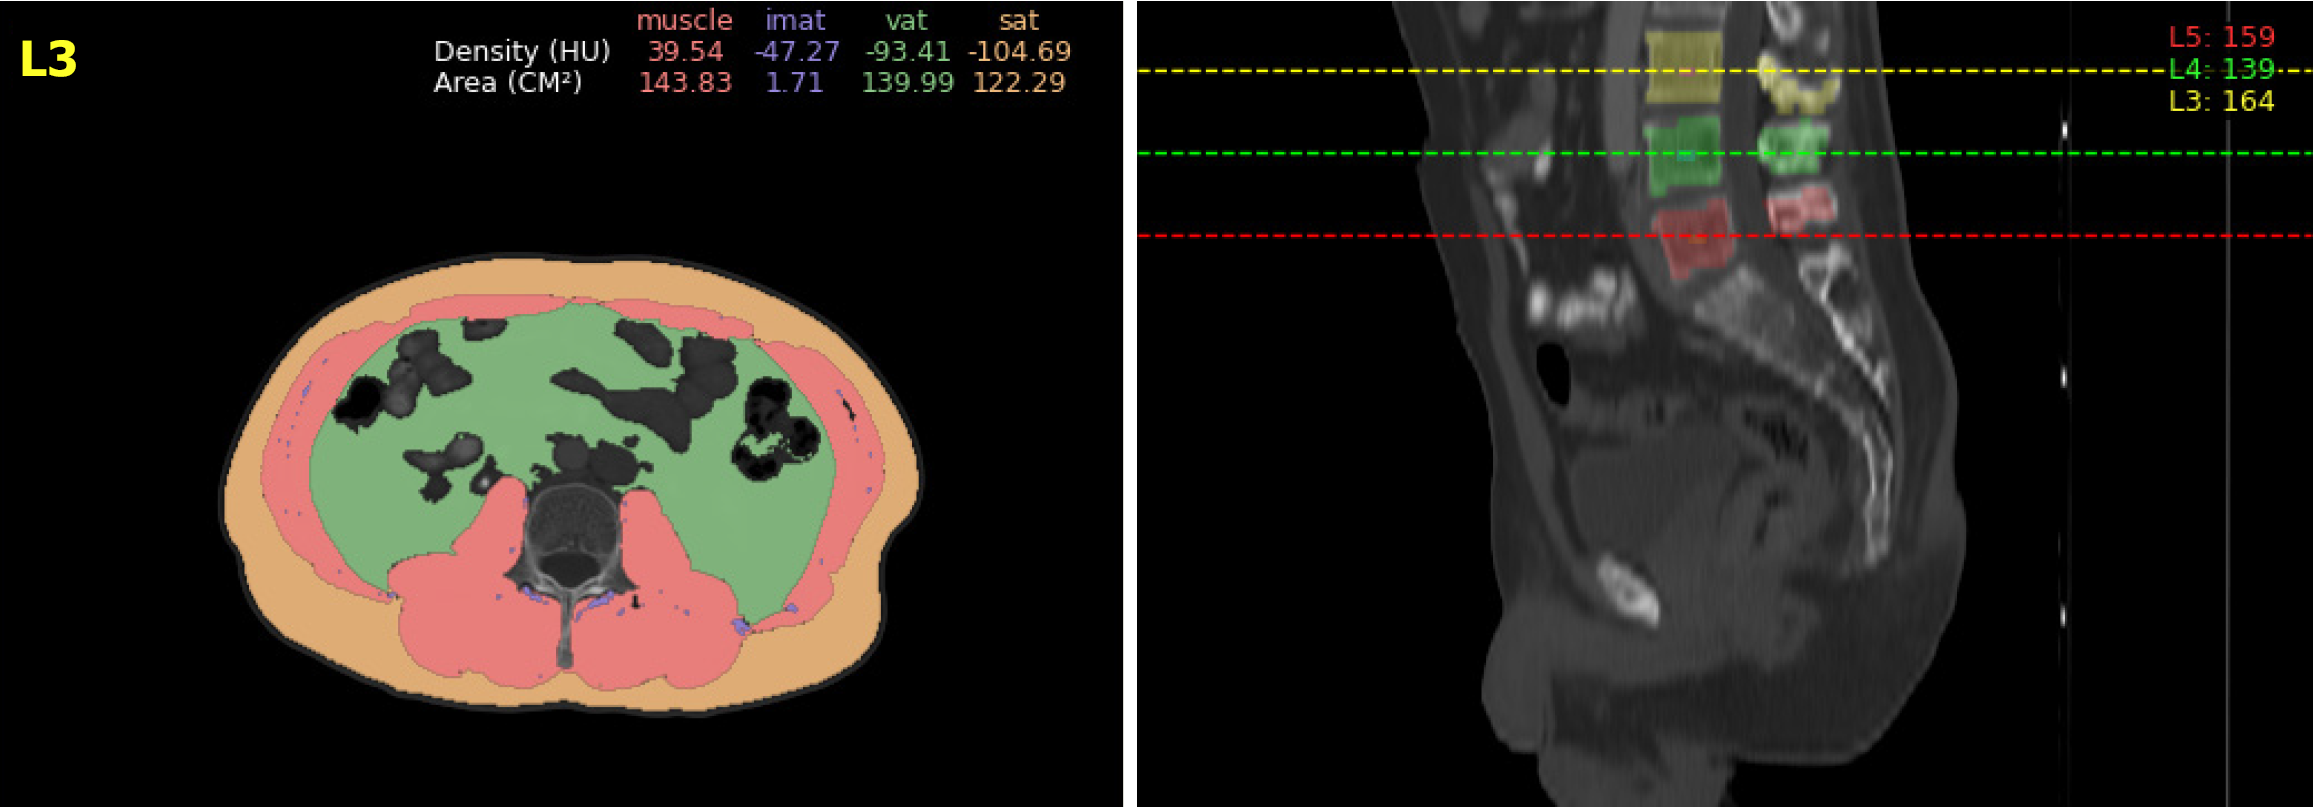
Figure 1 Segmented computed tomography images indicating skeletal muscle and fat distribution at the L3 level.
Axial and sagittal computed tomography images at the L3 level displaying segmented skeletal muscle (red), visceral fat (green), subcutaneous fat (peach), and intramuscular fat (blue). Skeletal muscle index was calculated to assess sarcopenia. HU: Hounsfield unit.
- Citation: Nie TT, Li YX, Yang X, Liu T, Niu XH, Guo XF, Liu YL. Tumor-related imaging parameters predict response and survival after neoadjuvant chemoradiotherapy in rectal cancer. World J Gastrointest Oncol 2026; 18(6): 117694
- URL: https://www.wjgnet.com/1948-5204/full/v18/i6/117694.htm
- DOI: https://dx.doi.org/10.4251/wjgo.v18.i6.117694