
















Copyright: ©Author(s) 2026.
World J Gastrointest Oncol. Jun 15, 2026; 18(6): 117582
Published online Jun 15, 2026. doi: 10.4251/wjgo.v18.i6.117582
Published online Jun 15, 2026. doi: 10.4251/wjgo.v18.i6.117582
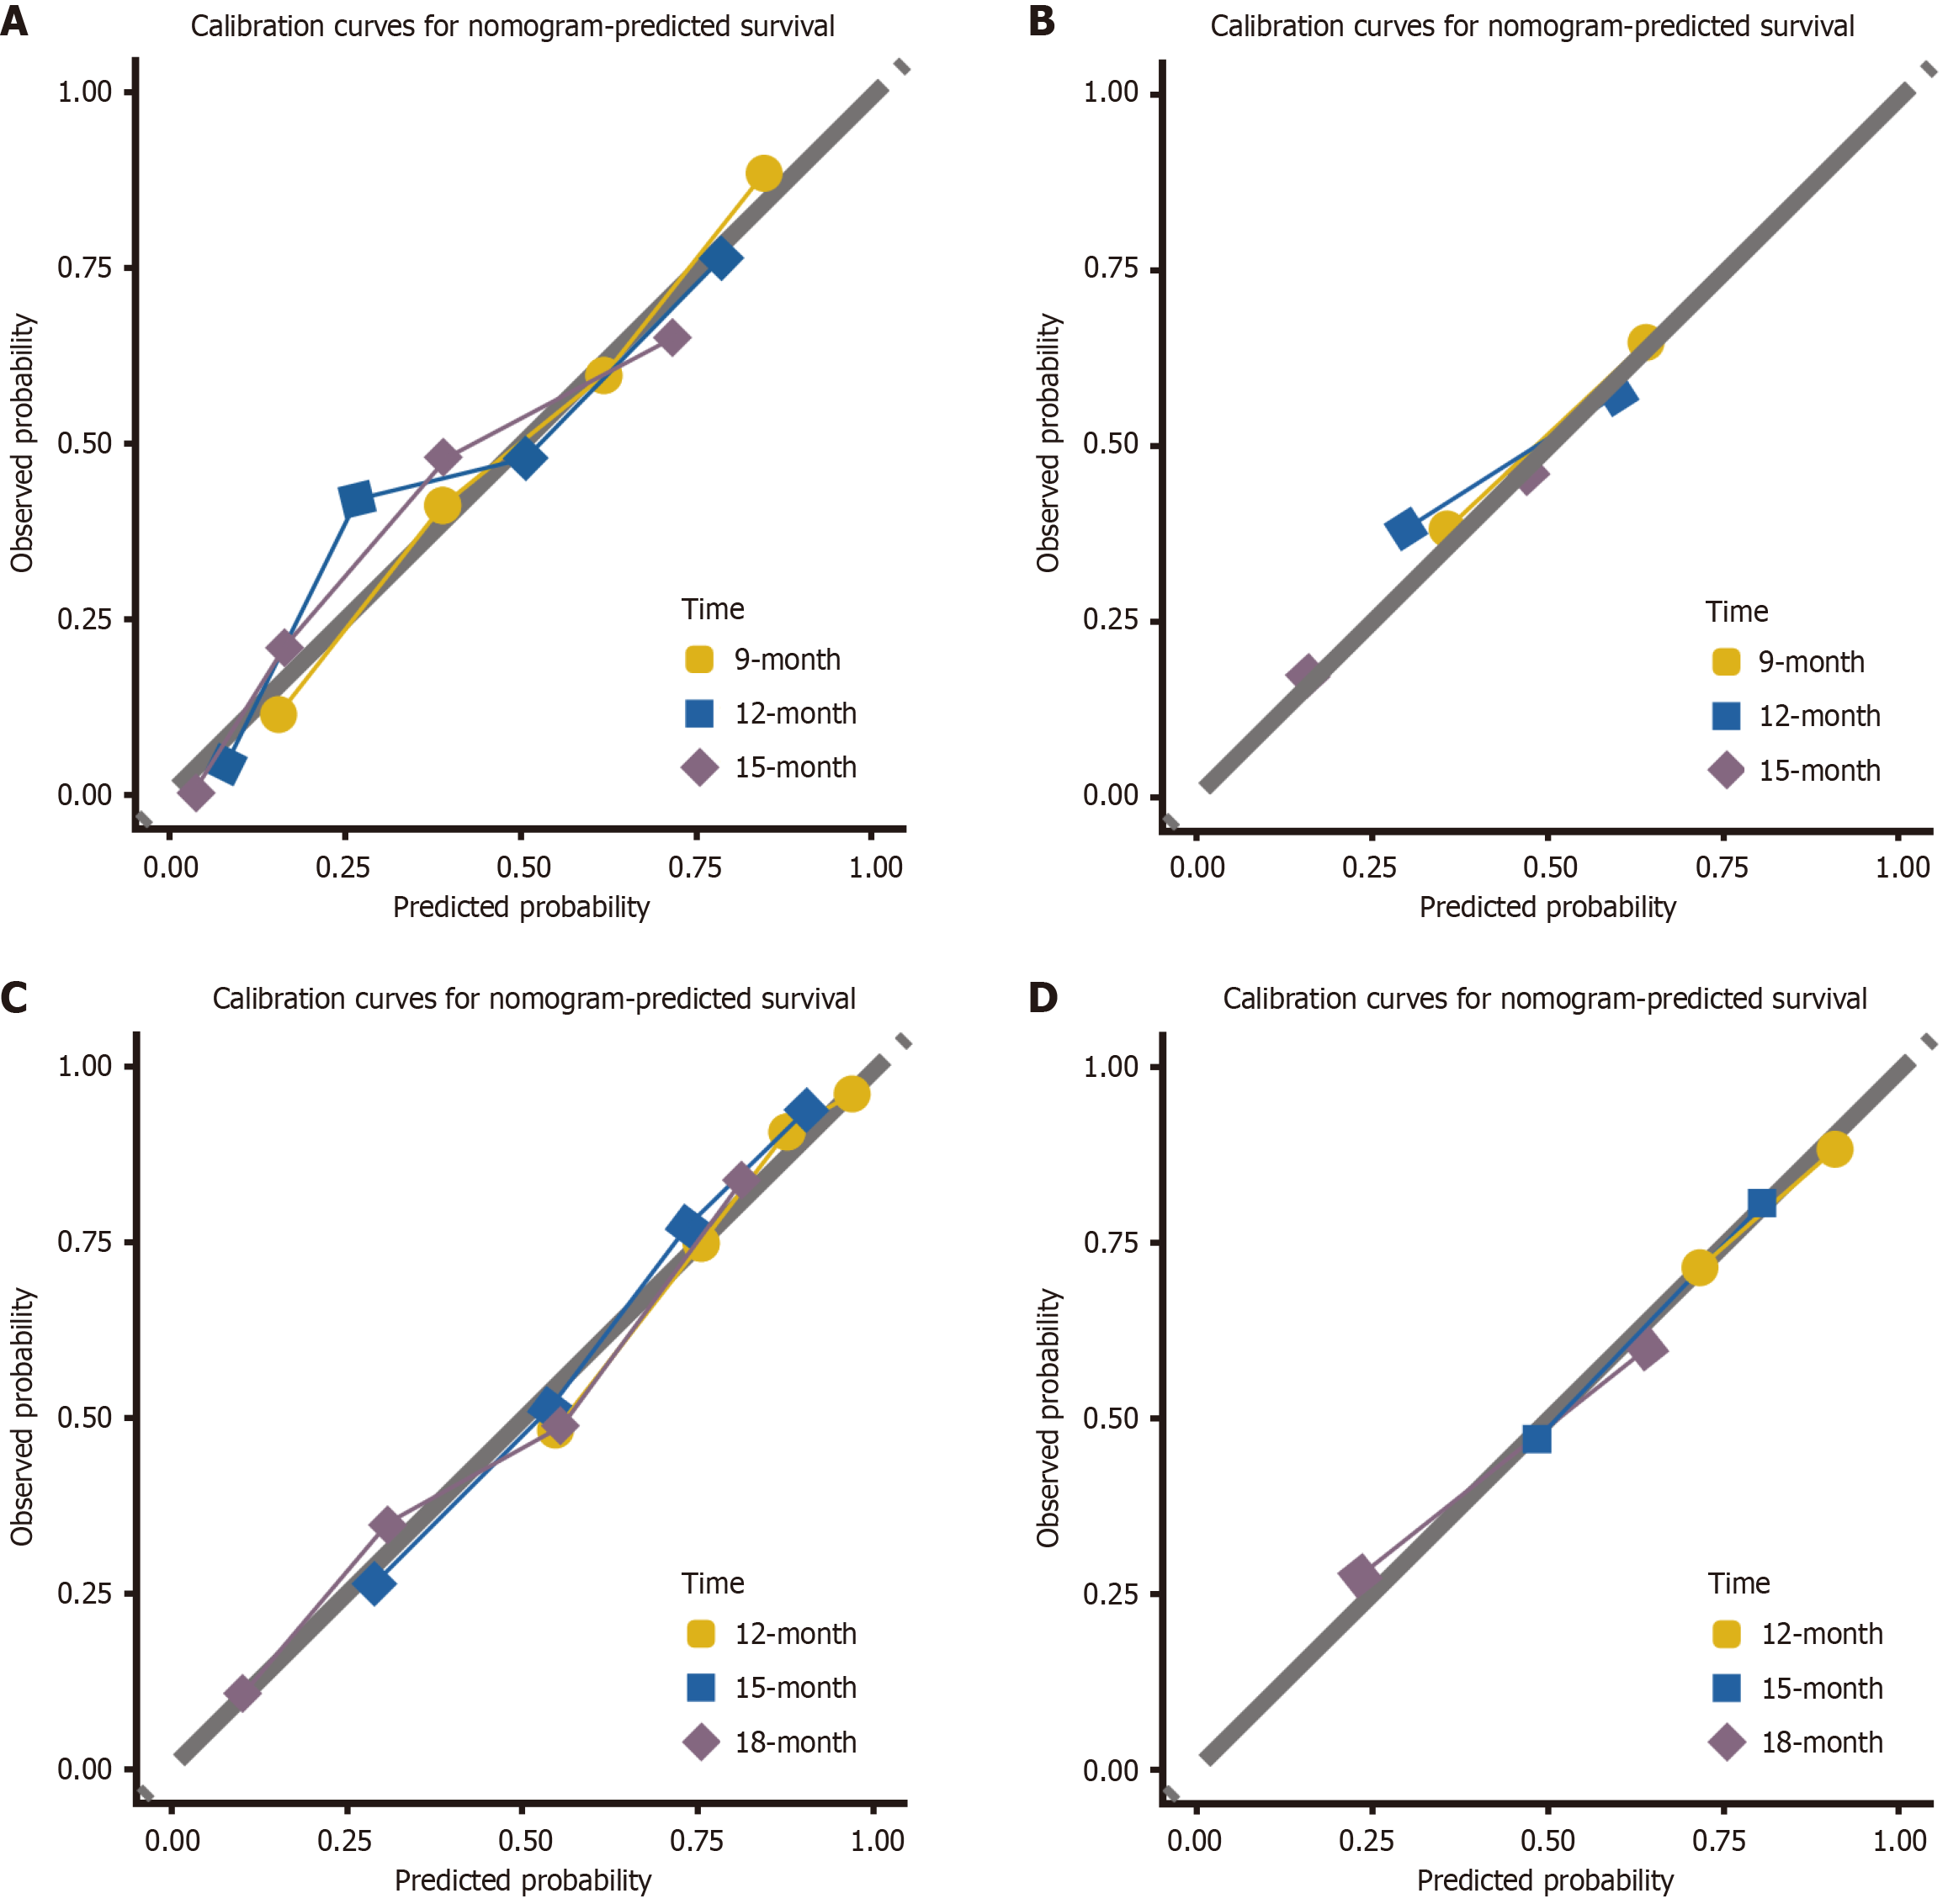
Figure 5 Graph illustrating the calibration plots for a prognostic model.
A: Calibration plots for the training set 9-, 12-, and 15-month progression-free survival (PFS); B: Calibration plots for the validation set 9-, 12-, and 15-month PFS; C: Calibration plots for the training set 12-, 15-, and 18-month overall survival (OS); D: Calibration plots for the validation set 12-, 15-, and 18-month OS.
- Citation: Mei S, Ye ML, Hao QL, Li GC, Yao ZY, Wang HY. Prognostic significance of baseline C-reactive protein/albumin ratio for long-term outcomes in advanced gastric cancer under immunochemotherapy. World J Gastrointest Oncol 2026; 18(6): 117582
- URL: https://www.wjgnet.com/1948-5204/full/v18/i6/117582.htm
- DOI: https://dx.doi.org/10.4251/wjgo.v18.i6.117582