
















Copyright: ©Author(s) 2026.
World J Gastrointest Oncol. Jun 15, 2026; 18(6): 117110
Published online Jun 15, 2026. doi: 10.4251/wjgo.v18.i6.117110
Published online Jun 15, 2026. doi: 10.4251/wjgo.v18.i6.117110
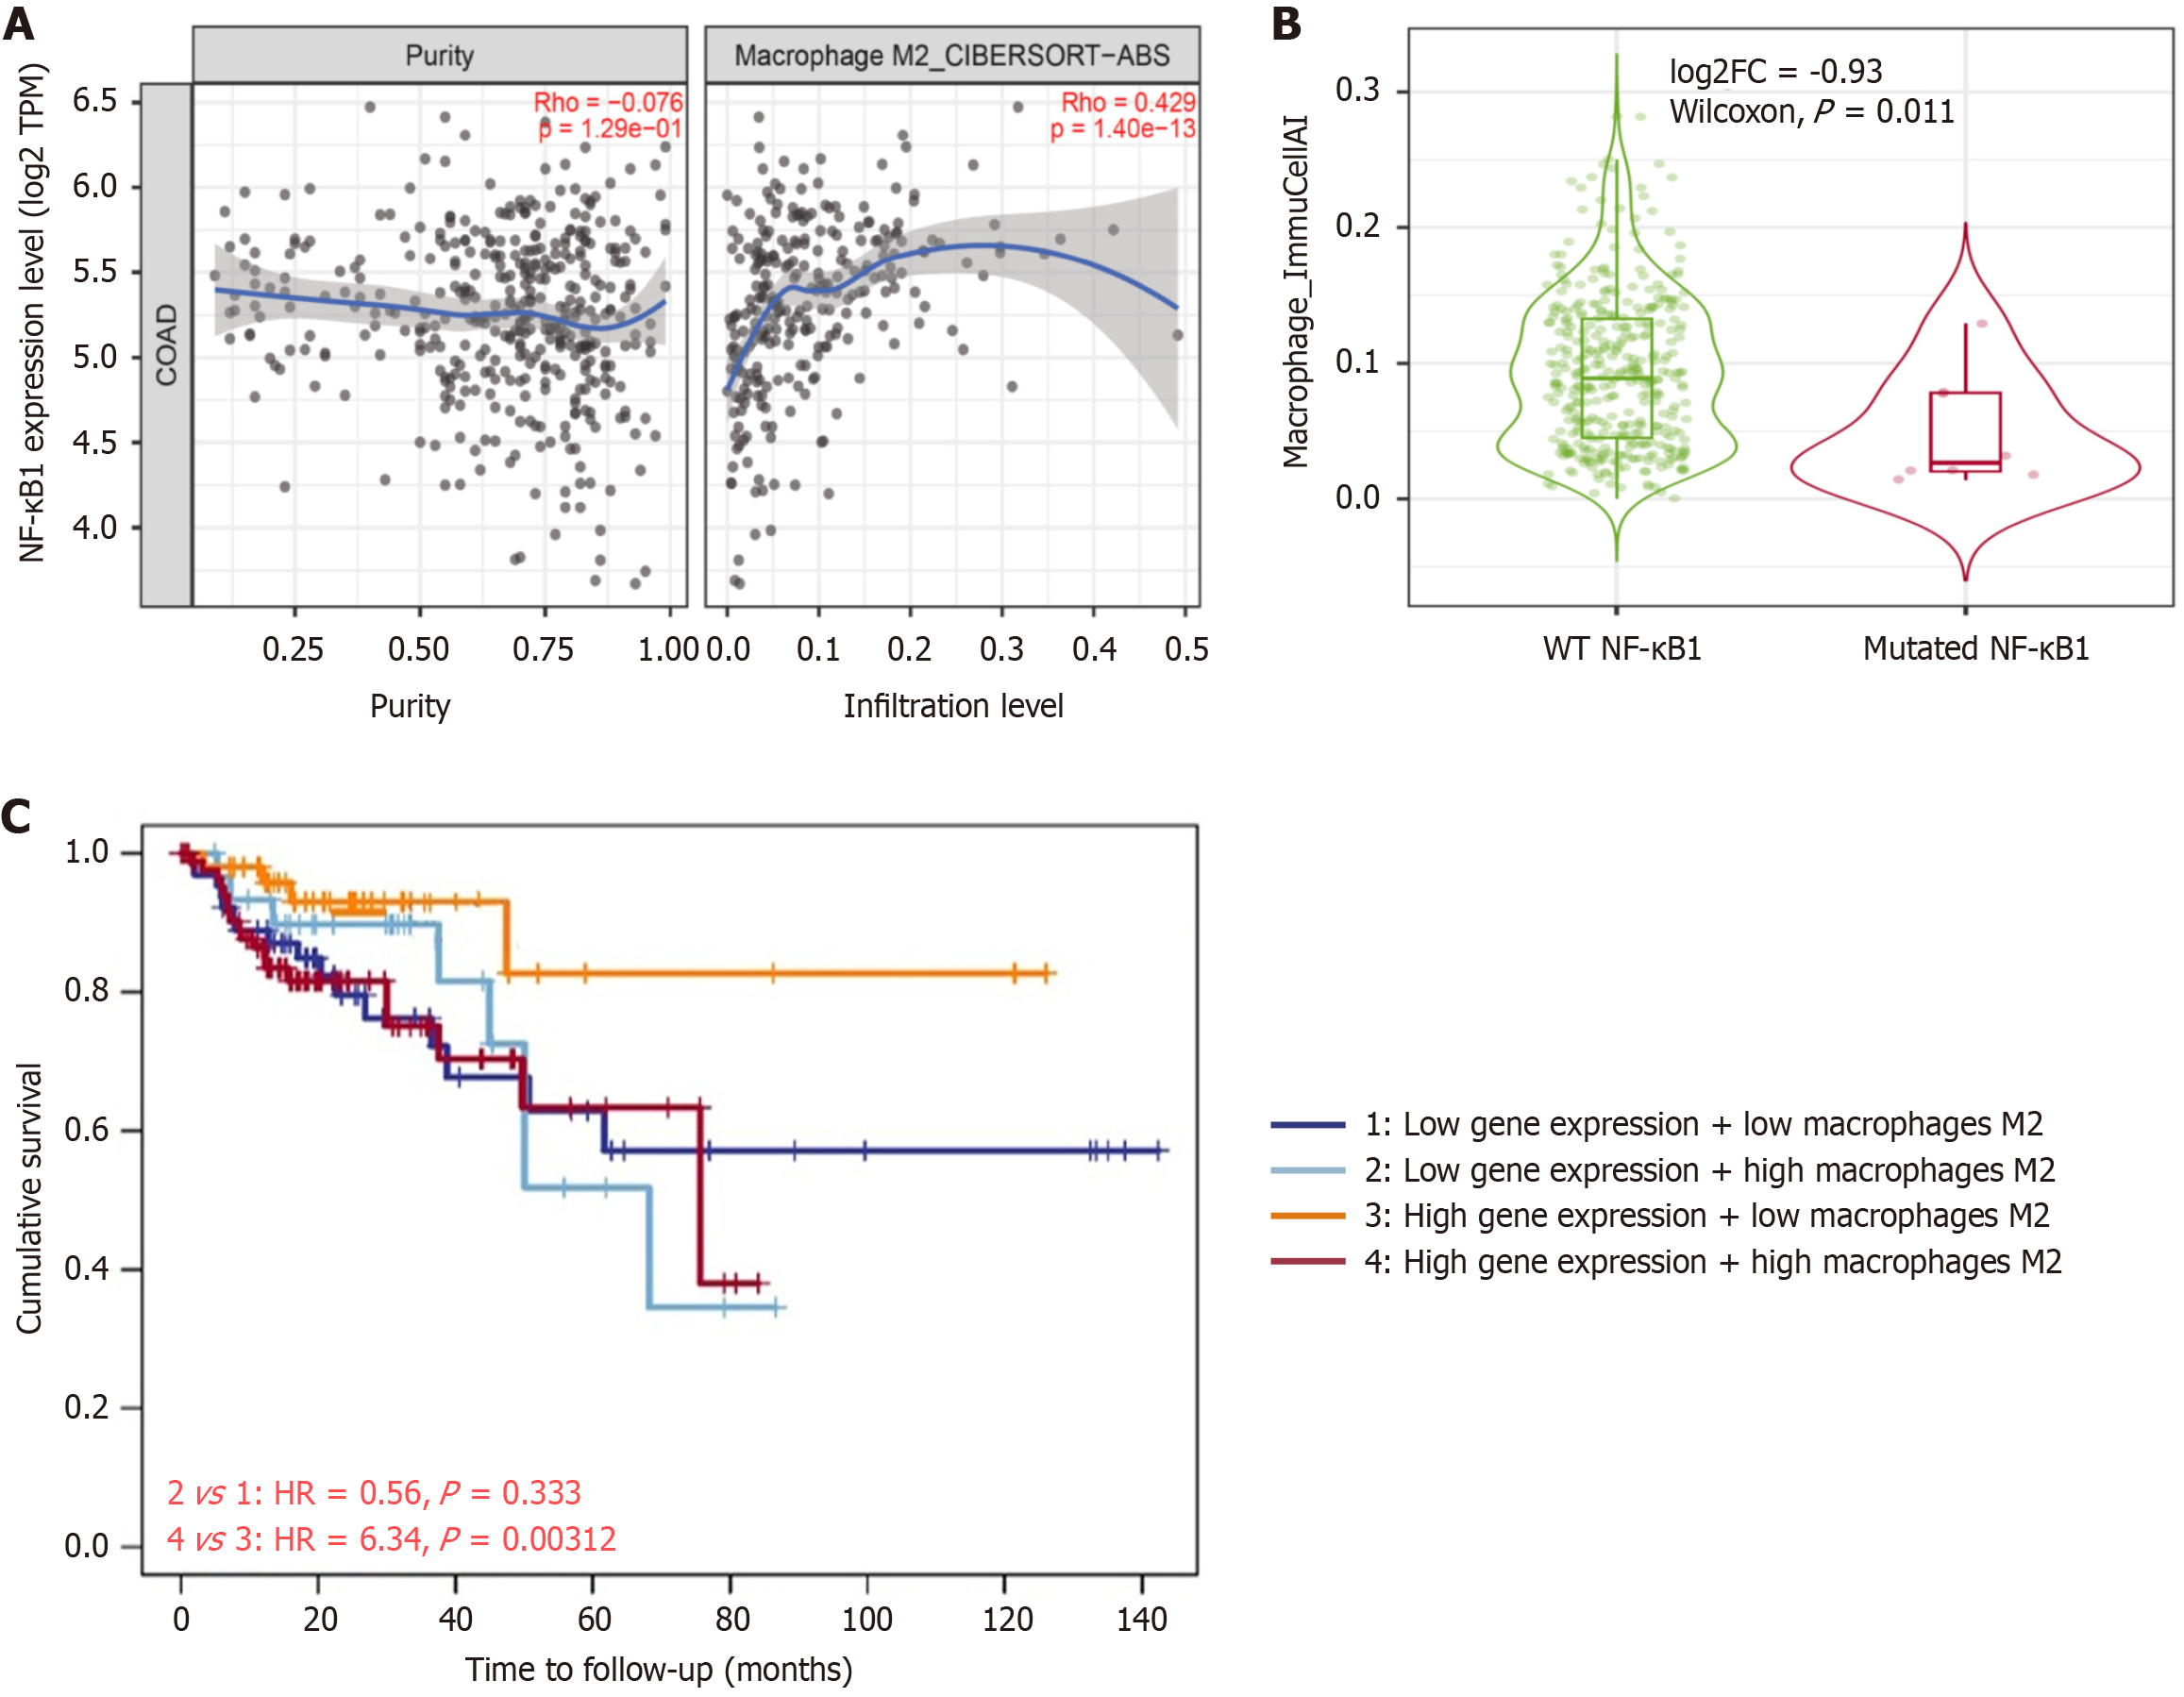
Figure 1 NF-κB correlates with M2 macrophages infiltration and disease-free interval in colorectal cancer (The cancer genomic atlas; tumor immune estimation resource version 3).
A: Correlation plots from the tumor immune estimation resource version 3 Gene module comparing NF-κB1 expression (log2 transcripts per million) vs tumor purity (left) and vs inferred M2 macrophage infiltration (right; CIBERSORT-ABS), with Spearman’s rho and P values displayed; B: Violin/box plots showing how M2 macrophages infiltration differs between wild-type and mutant NF-κB1 tumors (log2 FC = -0.93; Wilcoxon P = 0.011); C: Kaplan–Meier disease-free interval (DFI) curves categorized by NF-κB1 expression (high/Low) and M2 macrophage level (high/Low; quanTIseq). A high M2 Level only predicts a worse DFI in the NF-κB1-high group (HR = 6.34, P = 0.00312). When NF-κB1 is low, there is no significant difference (HR = 0.56, P = 0.333). TPM: Transcripts per million.
- Citation: El-Arabey AA. Letter to the Editor: Exosomal miR-191 activates the NF-κB pathway to drive M2 macrophages polarization in colorectal cancer. World J Gastrointest Oncol 2026; 18(6): 117110
- URL: https://www.wjgnet.com/1948-5204/full/v18/i6/117110.htm
- DOI: https://dx.doi.org/10.4251/wjgo.v18.i6.117110