
















Copyright: ©Author(s) 2026.
World J Gastrointest Oncol. Jun 15, 2026; 18(6): 117057
Published online Jun 15, 2026. doi: 10.4251/wjgo.v18.i6.117057
Published online Jun 15, 2026. doi: 10.4251/wjgo.v18.i6.117057
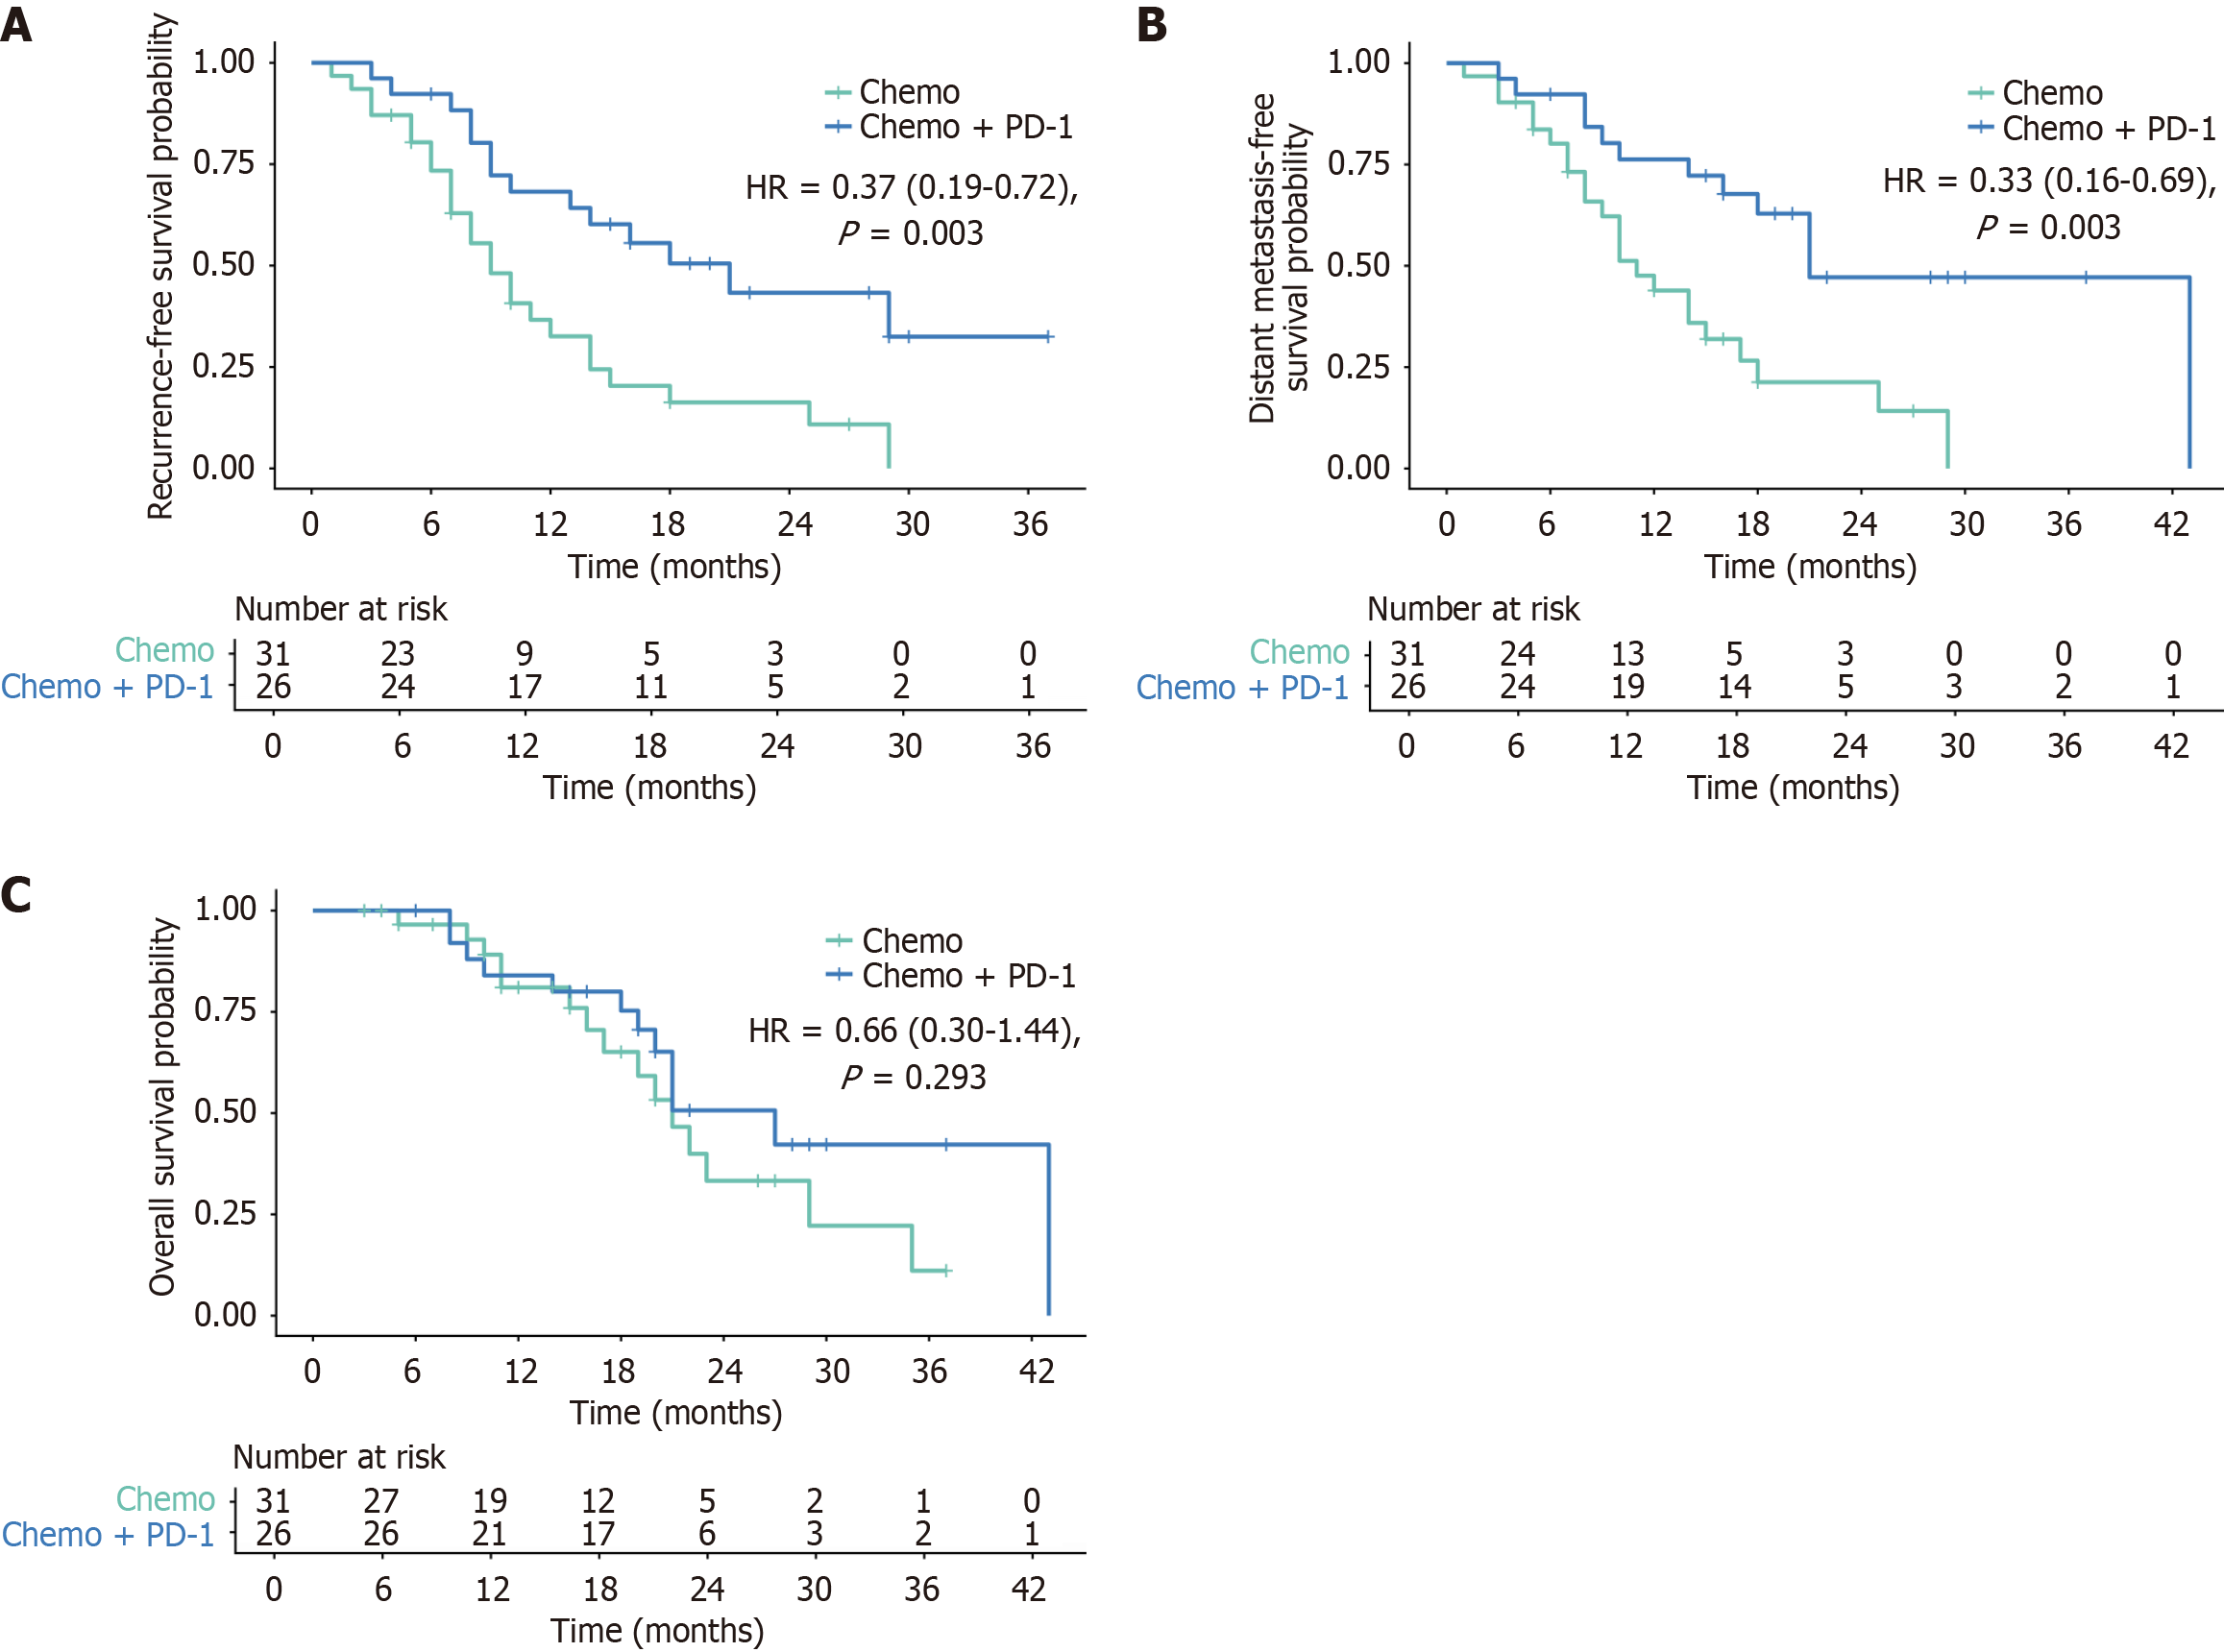
Figure 3 Kaplan-Meier survival curves comparing adjuvant treatment groups.
A: Recurrence-free survival was significantly longer in the Chemo + programmed death-1 (PD-1) group [hazard ratio (HR) = 0.37, 95% confidence interval (CI): 0.19-0.72; P = 0.003]; B: Distant metastasis-free survival was significantly prolonged in the Chemo + PD-1 group (HR = 0.33, 95%CI: 0.16-0.69; P = 0.003); C: Overall survival favored the Chemo + PD-1 group but was not statistically significant (HR = 0.66, 95%CI: 0.30-1.44; P = 0.293). The number of patients at risk is shown below each curve. PD-1: Programmed death-1; HR: Hazard ratio.
- Citation: Cao T, Deng XL, Xiao J, Tao XH, Xiang XL, Qiu M, Liang XY. Adjuvant programmed death-1 inhibition combined with chemotherapy in resected pancreatic cancer: A real-world cohort study. World J Gastrointest Oncol 2026; 18(6): 117057
- URL: https://www.wjgnet.com/1948-5204/full/v18/i6/117057.htm
- DOI: https://dx.doi.org/10.4251/wjgo.v18.i6.117057