
















Copyright: ©Author(s) 2026.
World J Gastrointest Oncol. Jun 15, 2026; 18(6): 117057
Published online Jun 15, 2026. doi: 10.4251/wjgo.v18.i6.117057
Published online Jun 15, 2026. doi: 10.4251/wjgo.v18.i6.117057
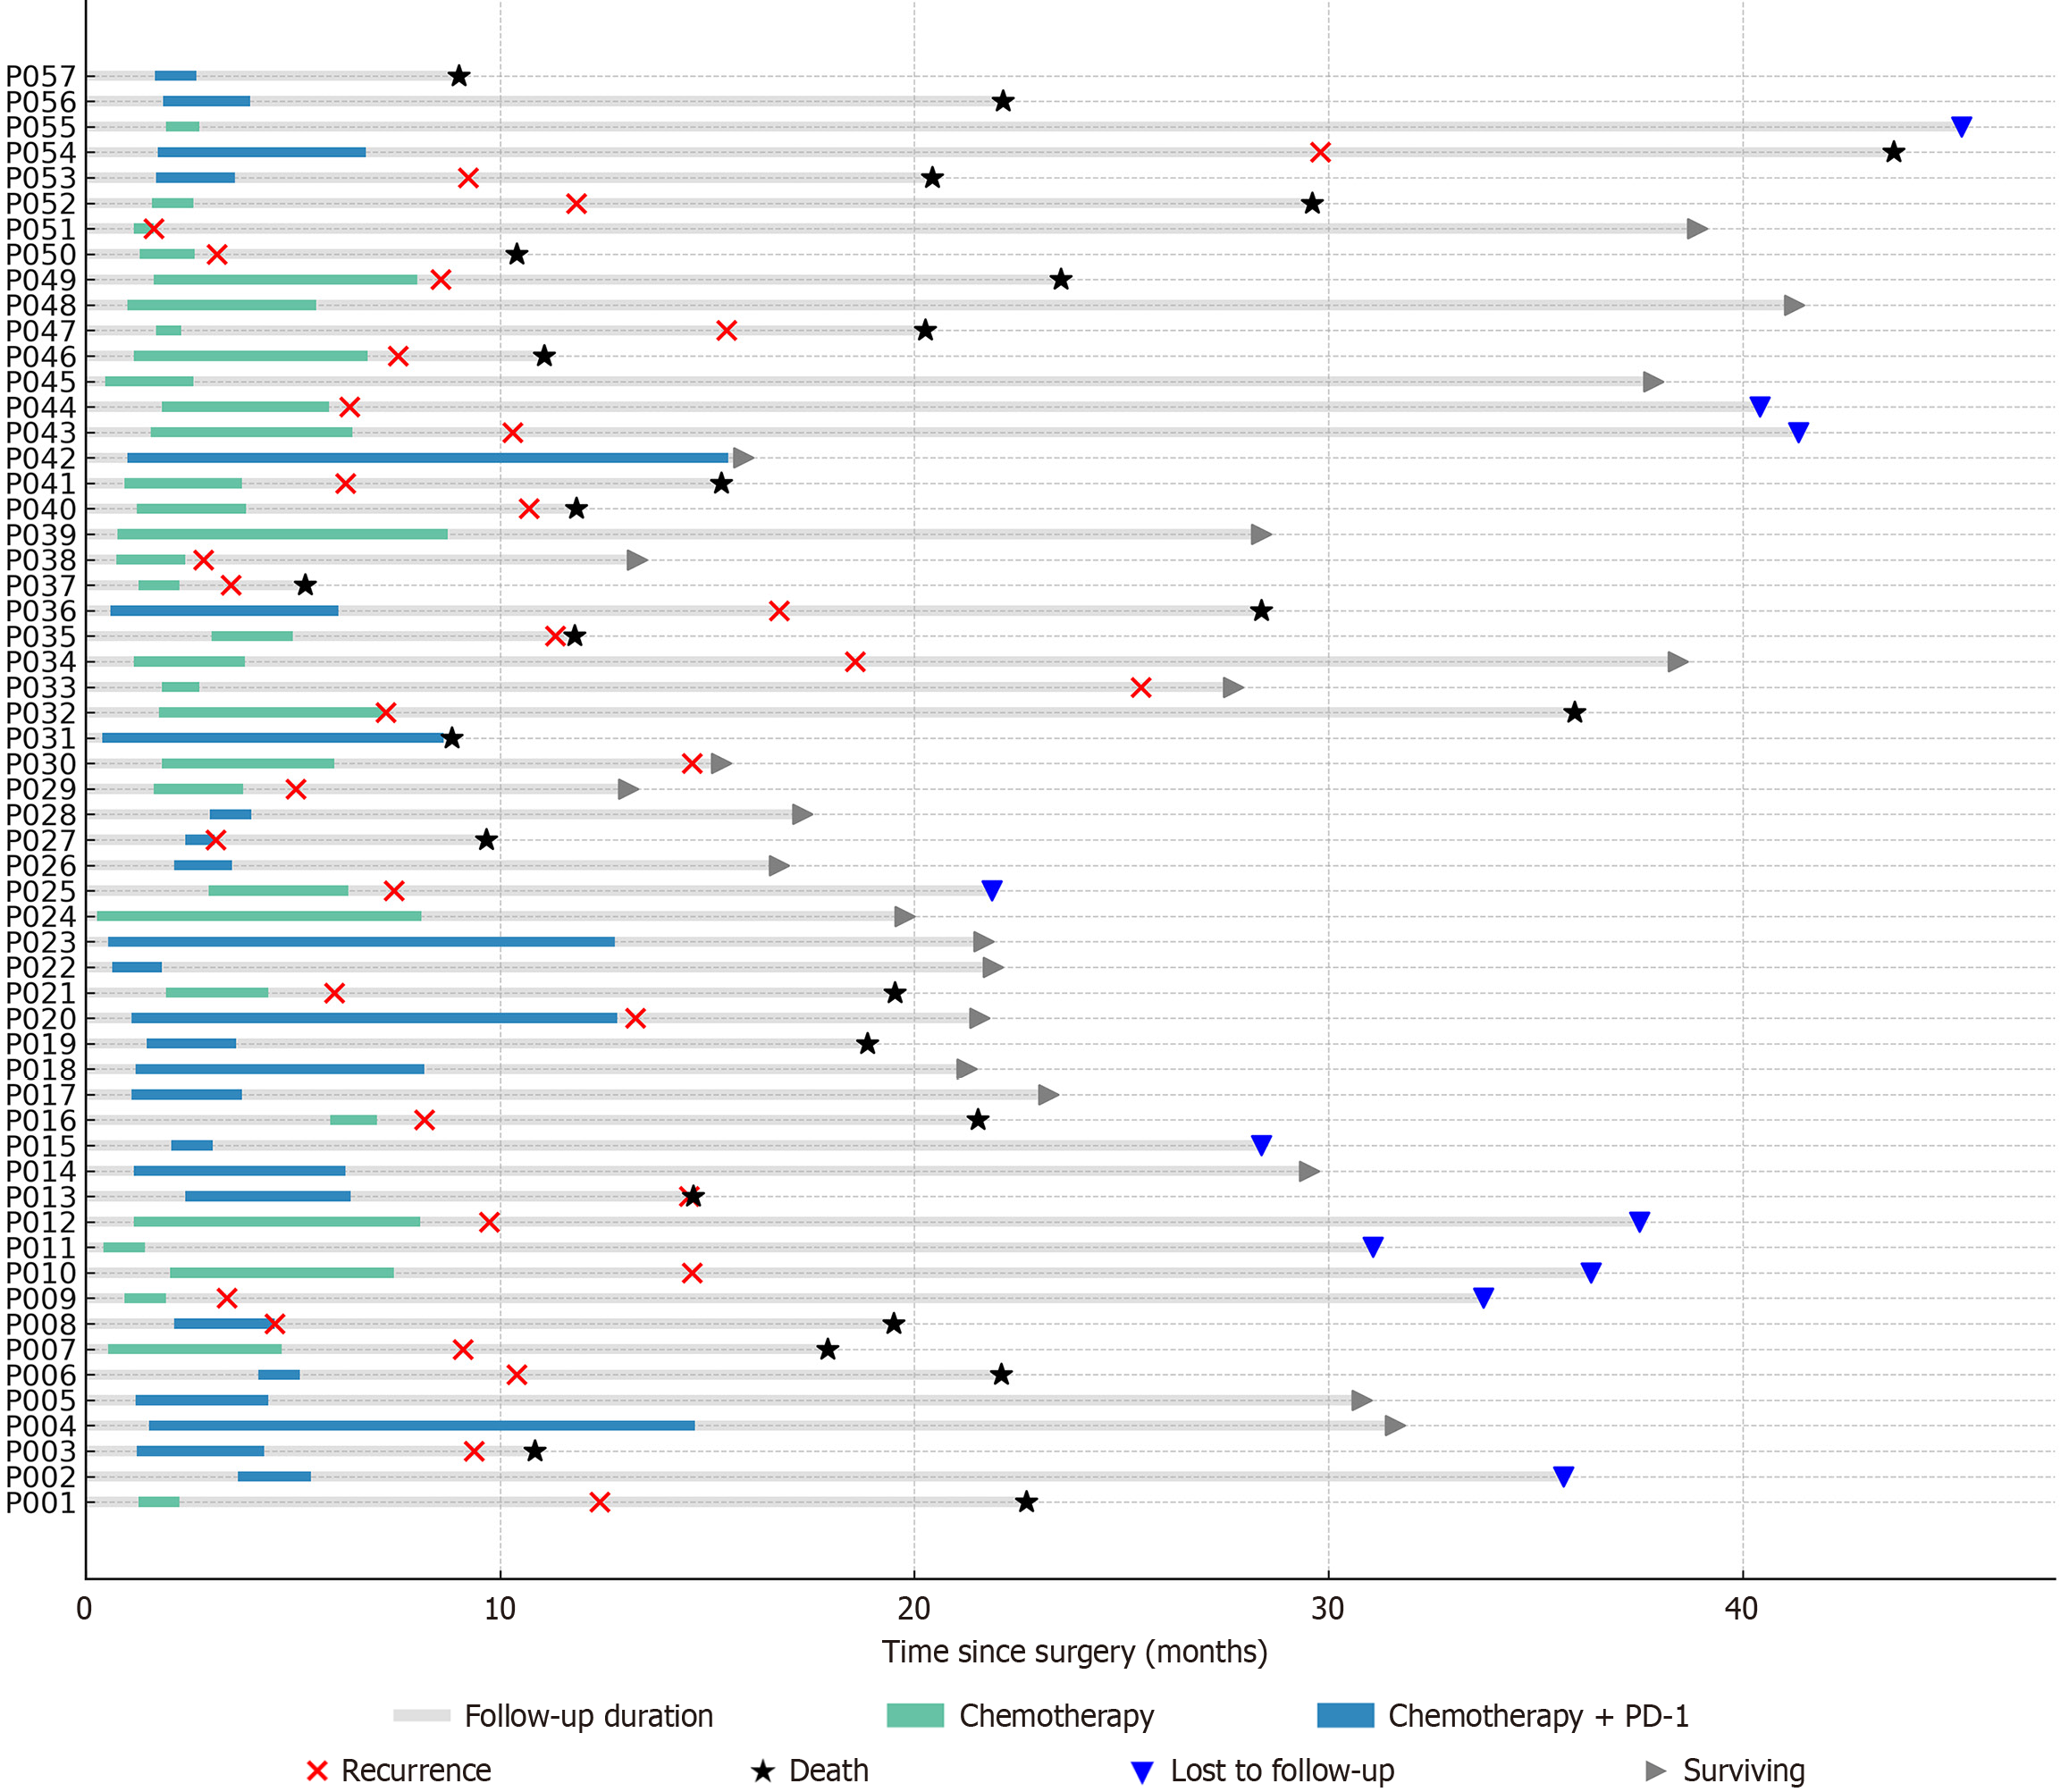
Figure 2 Swimmer plot depicting individual treatment courses and outcomes.
Each horizontal bar represents one patient’s clinical course. Gray bars indicate total follow-up duration; green segments represent chemotherapy alone; blue segments denote chemo-immunotherapy. Red crosses (x) indicate recurrence, black stars (★) indicate death, gray arrows (►) indicate survival at last follow-up, and downward blue triangles (▼) indicate loss to follow-up. The X-axis reflects months from surgery. PD-1: Programmed death-1.
- Citation: Cao T, Deng XL, Xiao J, Tao XH, Xiang XL, Qiu M, Liang XY. Adjuvant programmed death-1 inhibition combined with chemotherapy in resected pancreatic cancer: A real-world cohort study. World J Gastrointest Oncol 2026; 18(6): 117057
- URL: https://www.wjgnet.com/1948-5204/full/v18/i6/117057.htm
- DOI: https://dx.doi.org/10.4251/wjgo.v18.i6.117057