
















Copyright: ©Author(s) 2026.
World J Gastrointest Oncol. May 15, 2026; 18(5): 117323
Published online May 15, 2026. doi: 10.4251/wjgo.v18.i5.117323
Published online May 15, 2026. doi: 10.4251/wjgo.v18.i5.117323
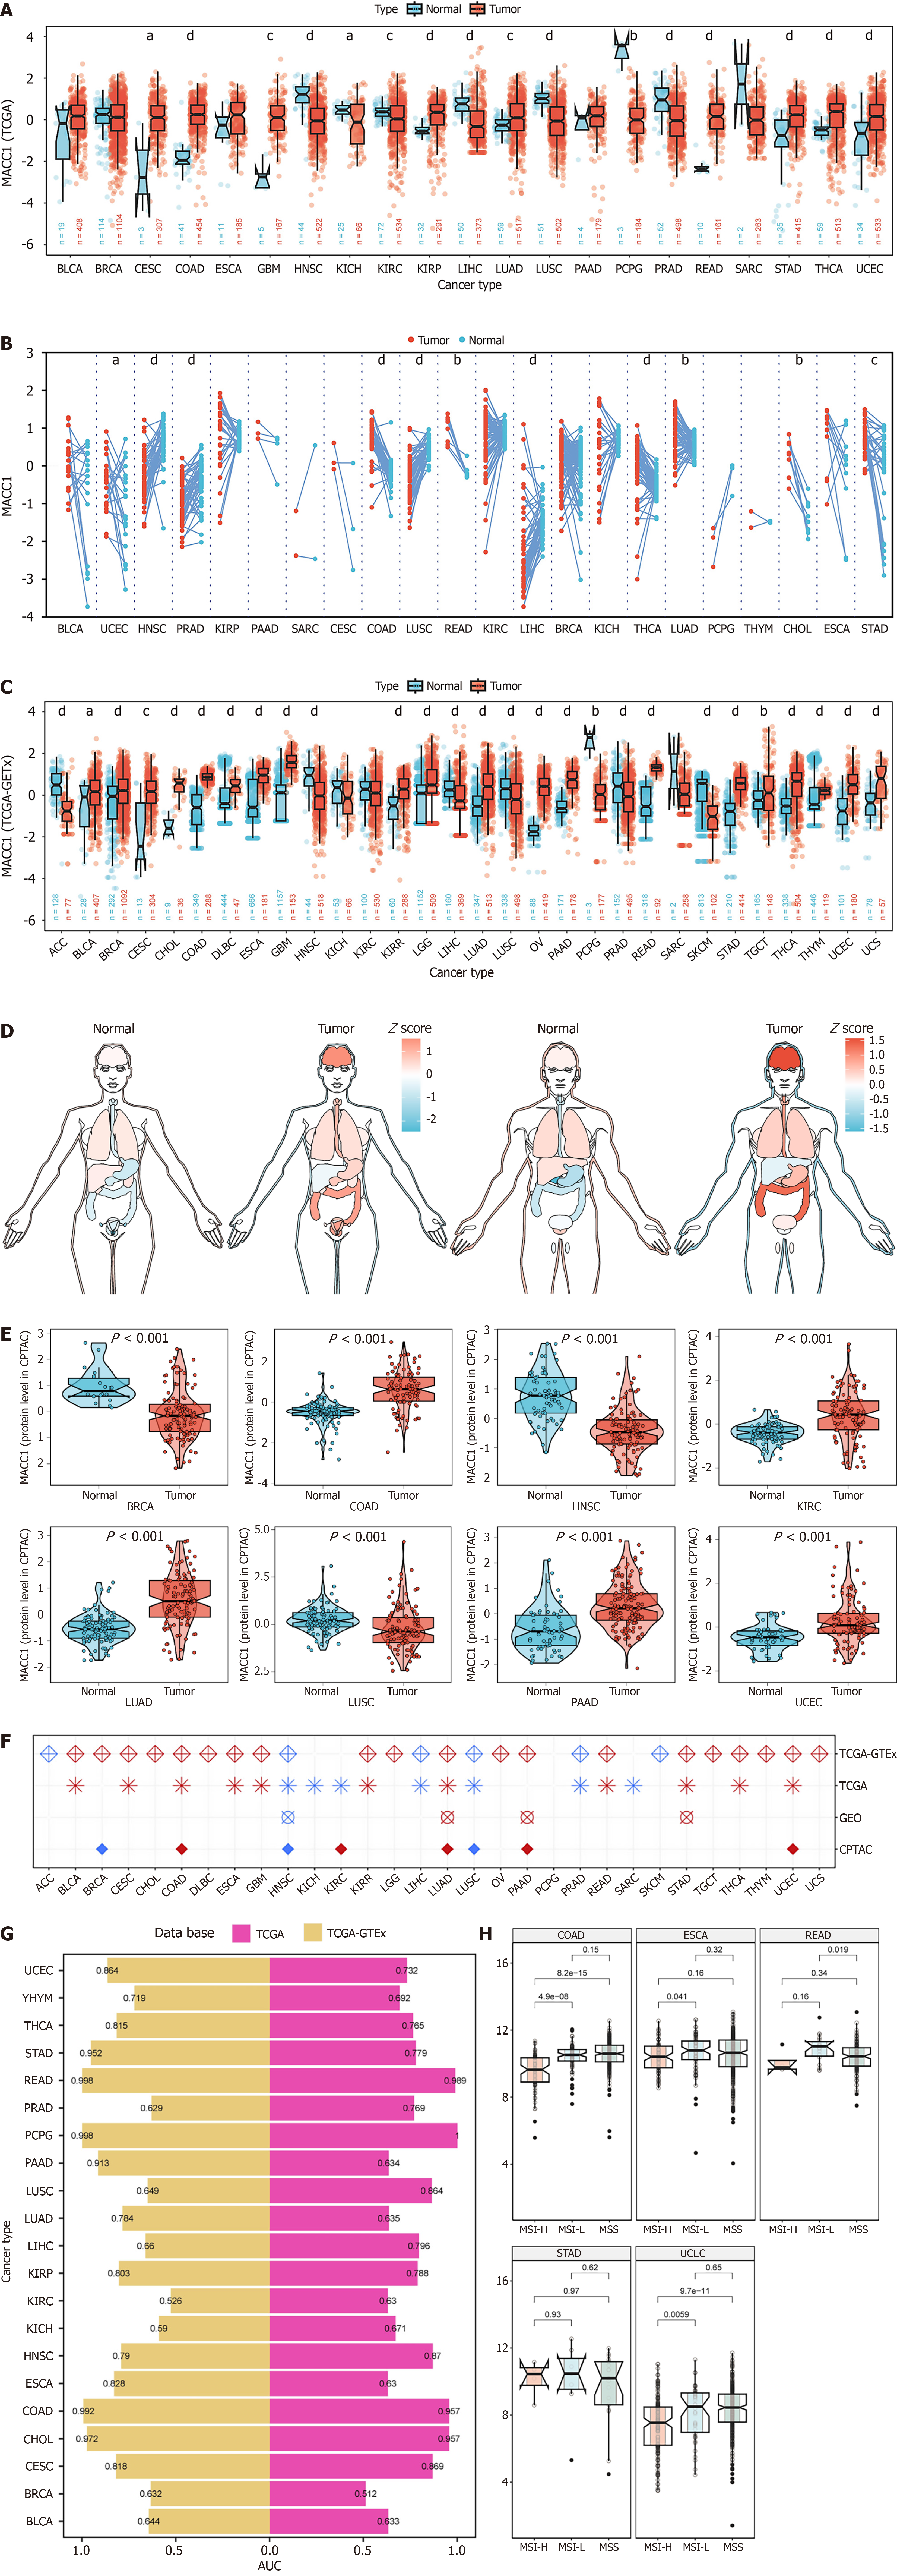
Figure 1 Expression of metastasis-associated colon cancer 1 among multiple cancer.
A: Y-axis showing the metastasis-associated colon cancer 1 (MACC1) the expression levels of mRNA in The Cancer Genome Atlas (TCGA). aP < 0.05, bP < 0.01, cP < 0.001, dP < 0.0001; B: As depicted from the figure boxplots showing minimum, and maximum, and median, and quartiles, each point showing one sample only more details are similar to Figure 1A, but group samples are paired. aP < 0.05, bP < 0.01, cP < 0.001, dP < 0.0001; C: Depicts the expression level of MACC1 in normal and tumor tissues and these details were collected from two different datasets known as Genotype-Tissue Expression and TCGA. aP < 0.05, bP < 0.01, cP < 0.001, dP < 0.0001; D: In various organs the distribution and expression of MACC1; E: It further depicts the validation of different protein levels externally, and this was performed using a CPTAC database as per requirements; F: Here, the Y-axis indicates the levels of genetic expression: Analysis based on logistic regression for TCGA and TCGA-Genotype-Tissue Expression, where red is 1 or greater number, blue shows values between 0 and 1, a white circle denotes no significance, and no collection of relevant data set was depicted by an empty value); G: Diagnostic value of MACC1 for distinguishing different tissues (tumor and normal); H: Wilcoxon rank-sum test showing the differences in MACC1 expression in microsatellite instability. AUC: Area under the curve; GTEx: Genotype-Tissue Expression; MACC1: Metastasis-associated colon cancer 1; TCGA: The Cancer Genome Atlas.
- Citation: Cong L, Tong S, Xu YJ, Zhang DY, Zhang XM, Yu H. Metastasis-associated colon cancer 1 drives pancreatic cancer via p53/Notch signaling. World J Gastrointest Oncol 2026; 18(5): 117323
- URL: https://www.wjgnet.com/1948-5204/full/v18/i5/117323.htm
- DOI: https://dx.doi.org/10.4251/wjgo.v18.i5.117323