
















Copyright: ©Author(s) 2026.
World J Gastrointest Oncol. May 15, 2026; 18(5): 116568
Published online May 15, 2026. doi: 10.4251/wjgo.v18.i5.116568
Published online May 15, 2026. doi: 10.4251/wjgo.v18.i5.116568
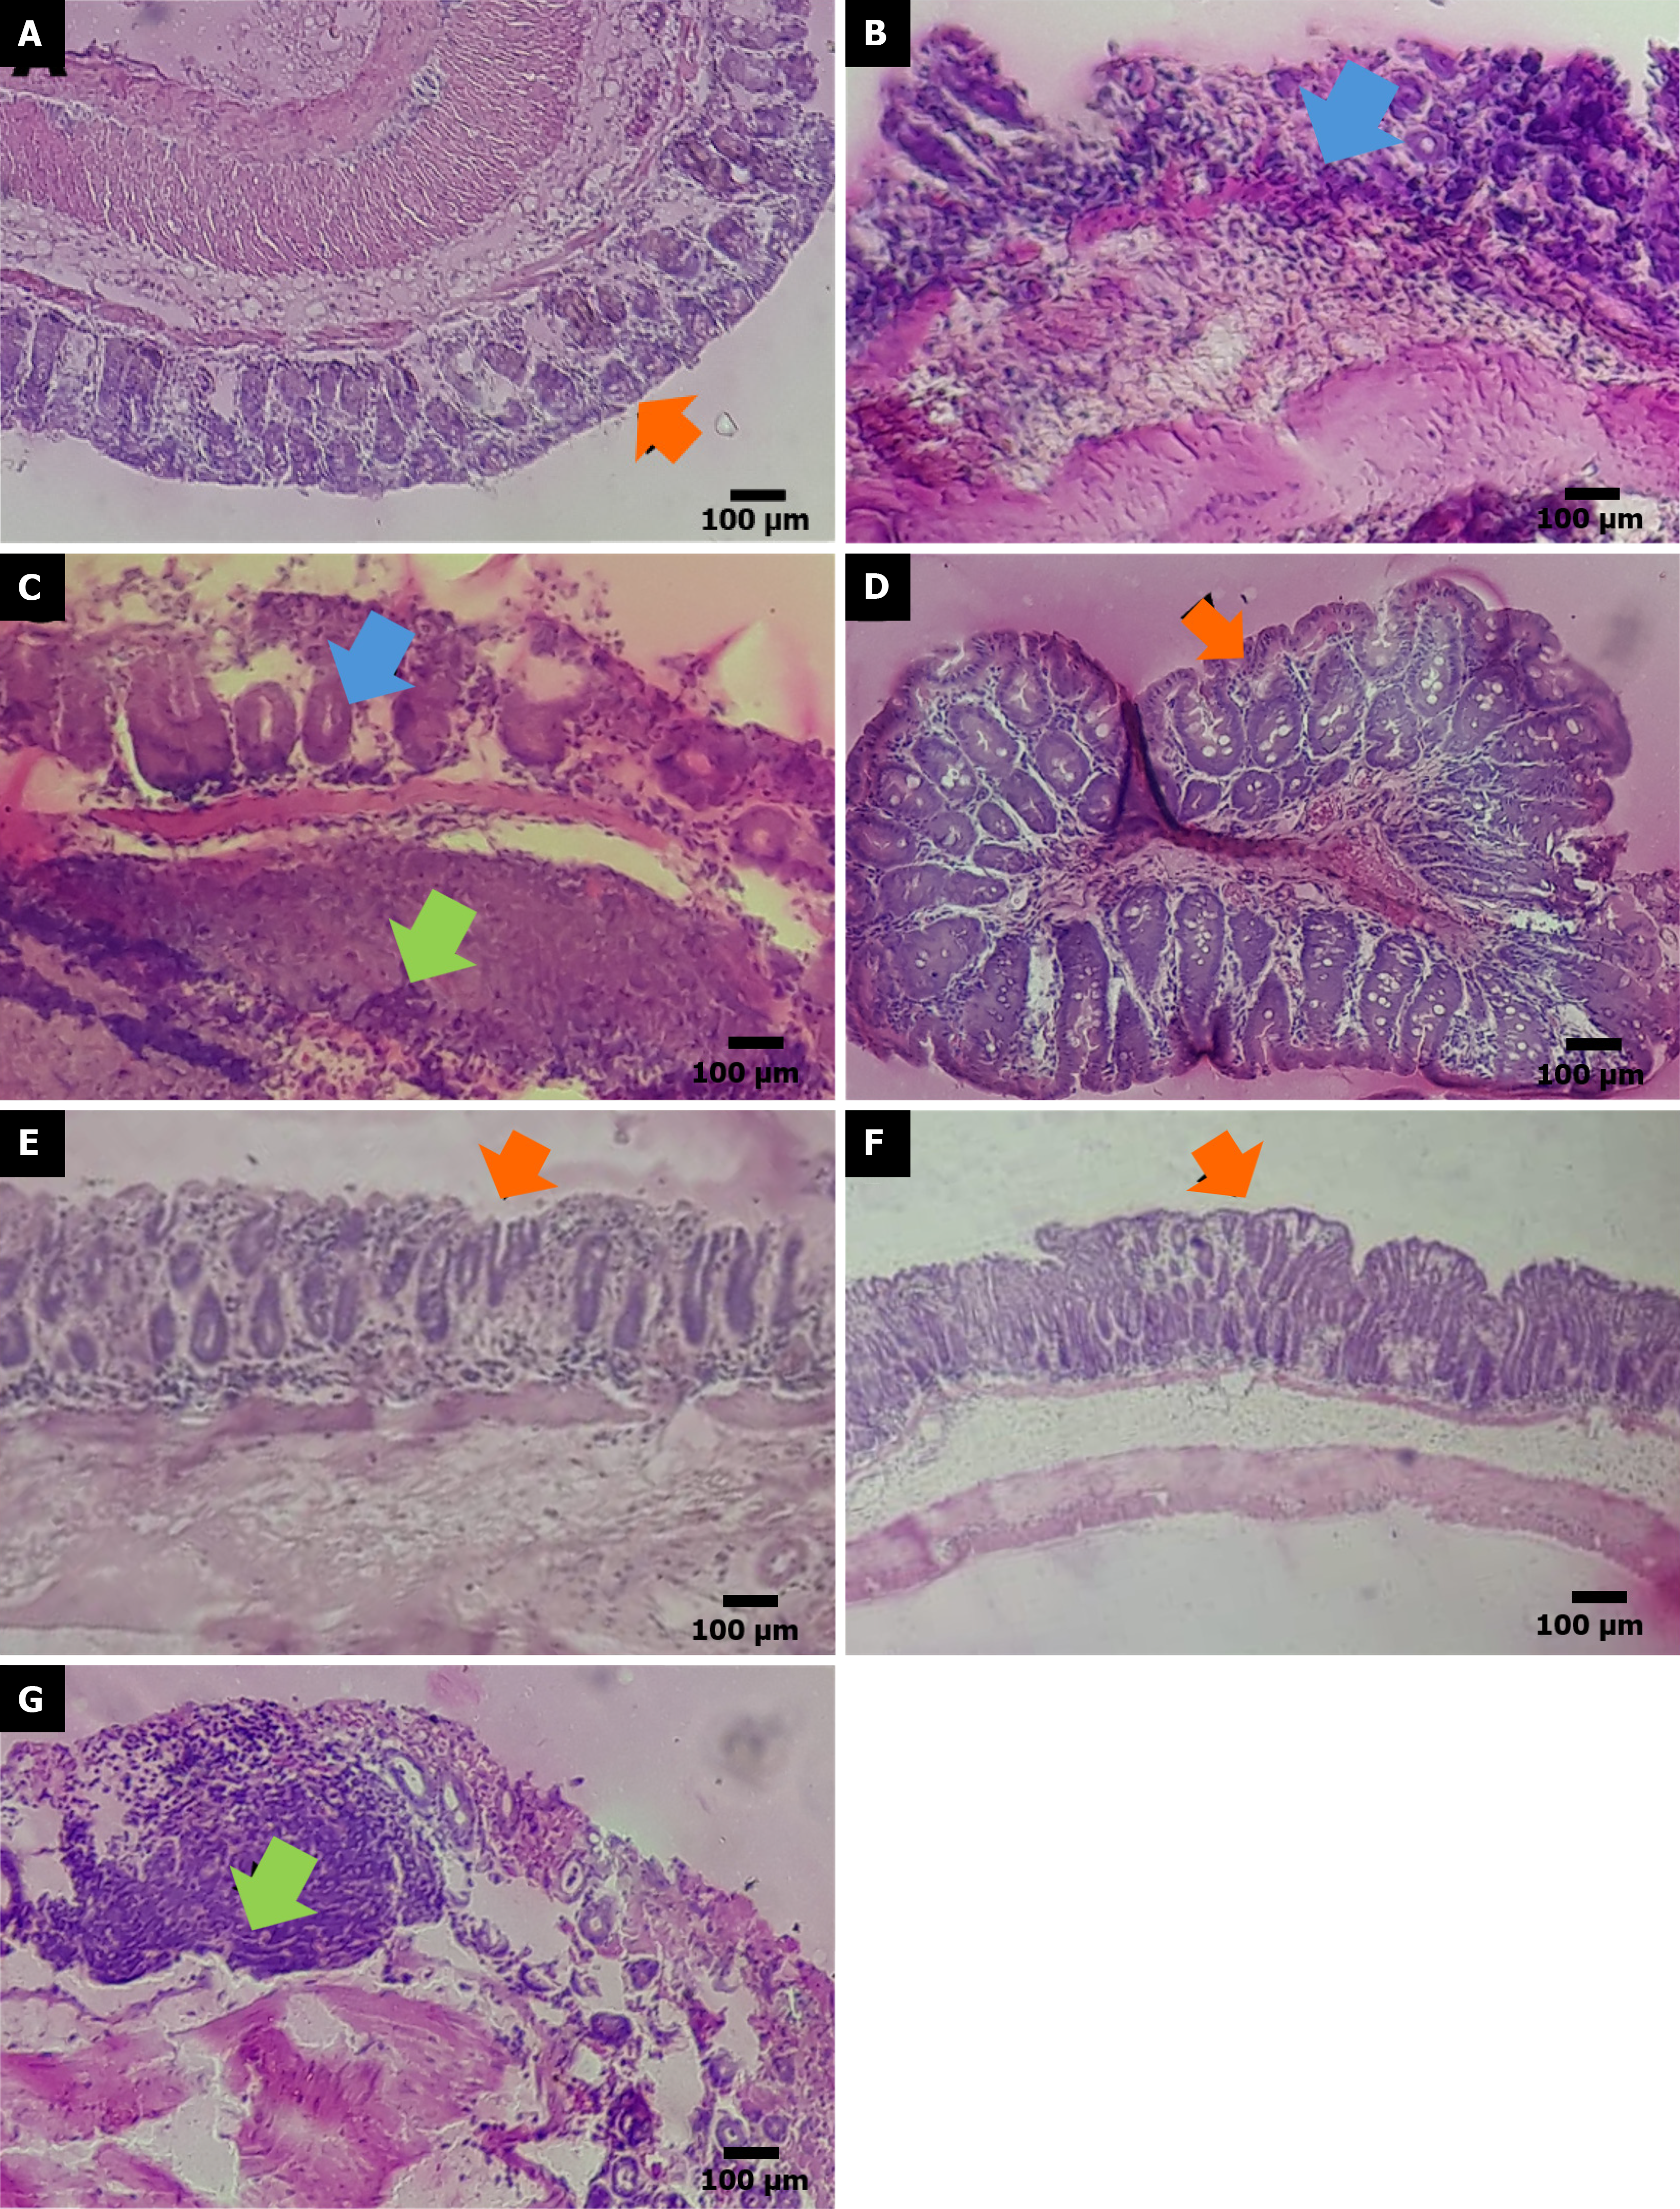
Figure 6 Photomicrographs representing histological sections of colon tissue stained with hematoxylin-eosin.
A: Negative control group (saline); B: Acetic acid-treated group; C: Keto-alcoholic extract of Butia capitata at 10 mg/kg; D: Keto-alcoholic extract of Butia capitata at 30 mg/kg; E: Keto-alcoholic extract of Butia capitata at 100 mg/kg; F: Keto-alcoholic extract of Butia capitata at 300 mg/kg; G: Mesalazine treated group. The green arrows indicate inflammatory infiltrate, the blue arrows show loss of crypt architecture, and the orange arrows demonstrates a spot with preserved crypts and epithelial barrier.
- Citation: Da Silva PB, Lopes-Bute L, Fischer J, Parcianello AP, Pires-Duarte R, Luiz RM, Brandalize APC, Melo FF, Wendel CF, Teixeira KN, Zarpelon-Schutz AC. Protective effects of Butia capitata extract against colitis-driven colorectal tumorigenesis: Insights into its anti-inflammatory and antinociceptive activities. World J Gastrointest Oncol 2026; 18(5): 116568
- URL: https://www.wjgnet.com/1948-5204/full/v18/i5/116568.htm
- DOI: https://dx.doi.org/10.4251/wjgo.v18.i5.116568