
















Copyright: ©Author(s) 2026.
World J Gastrointest Oncol. May 15, 2026; 18(5): 115303
Published online May 15, 2026. doi: 10.4251/wjgo.v18.i5.115303
Published online May 15, 2026. doi: 10.4251/wjgo.v18.i5.115303
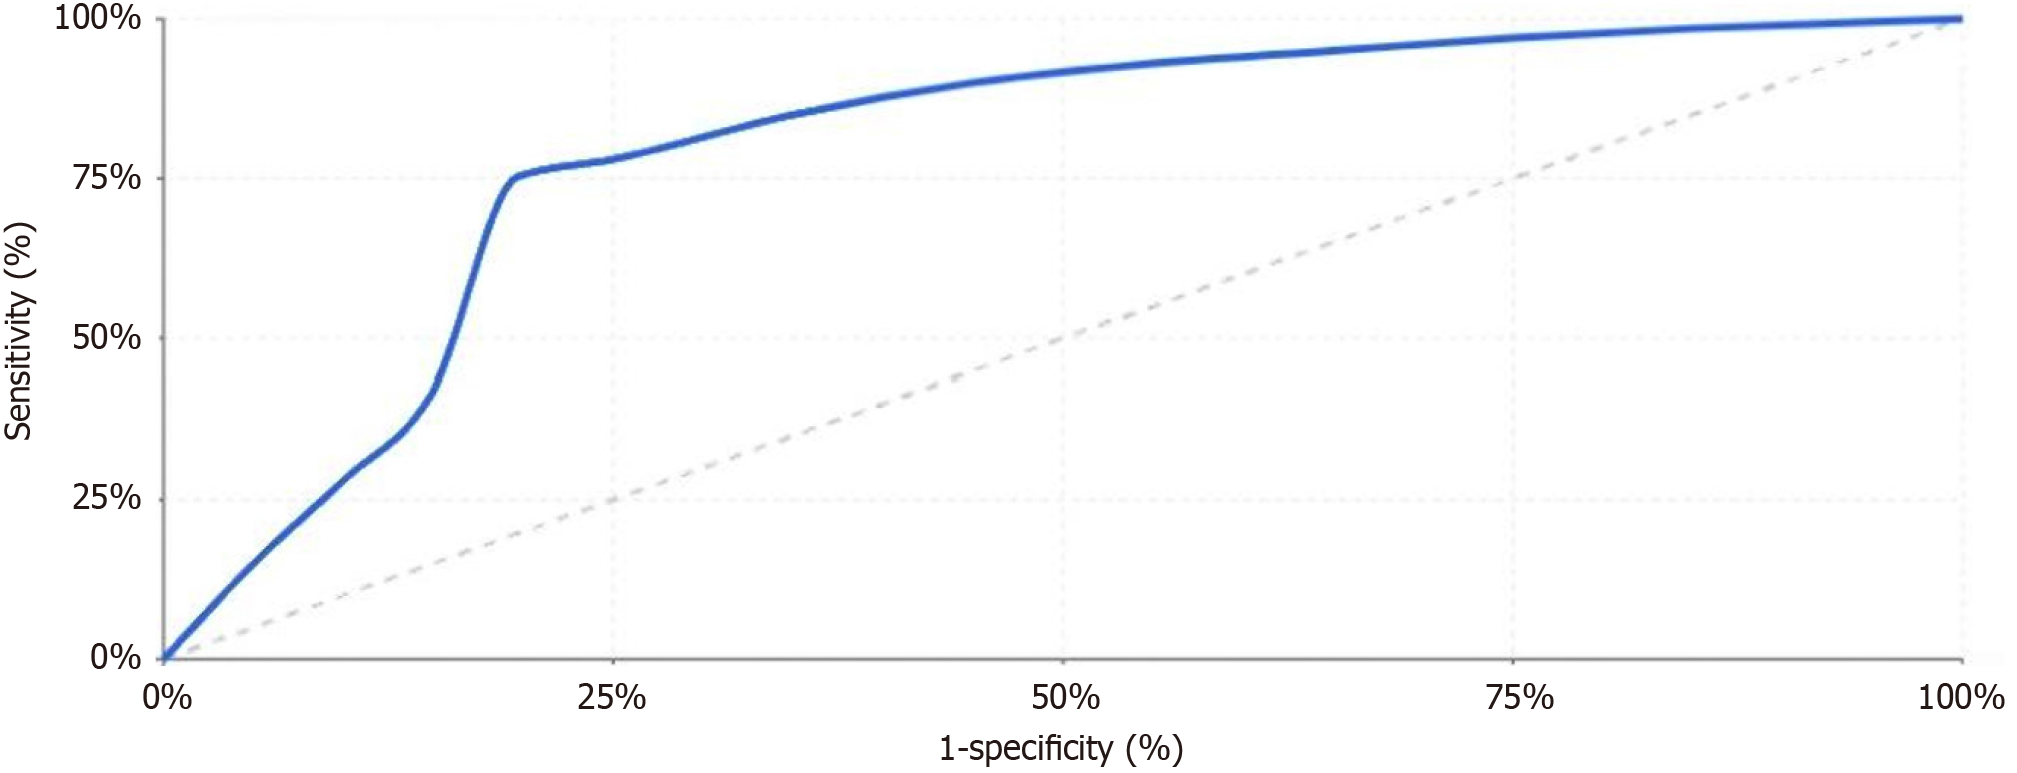
Figure 3 Receiver operating characteristic curve analysis for postoperative complications prediction model.
Receiver operating characteristic curve for the nomogram model. The blue curve represents the predictive performance of the model, while the gray dashed diagonal line indicates the reference line (random chance). The area under the curve demonstrates the model’s discriminative ability in predicting postoperative complications, with values closer to 1.0 indicating better predictive accuracy.
- Citation: Duan R, Li HL, Deng L, Zhao Q, Yang RW, Wu ZL. Preoperative spectral computed tomography multi-parameter prediction of postoperative complications in colorectal cancer: A single-center retrospective cohort study. World J Gastrointest Oncol 2026; 18(5): 115303
- URL: https://www.wjgnet.com/1948-5204/full/v18/i5/115303.htm
- DOI: https://dx.doi.org/10.4251/wjgo.v18.i5.115303