
















Copyright: ©Author(s) 2026.
World J Gastrointest Oncol. Apr 15, 2026; 18(4): 116104
Published online Apr 15, 2026. doi: 10.4251/wjgo.v18.i4.116104
Published online Apr 15, 2026. doi: 10.4251/wjgo.v18.i4.116104
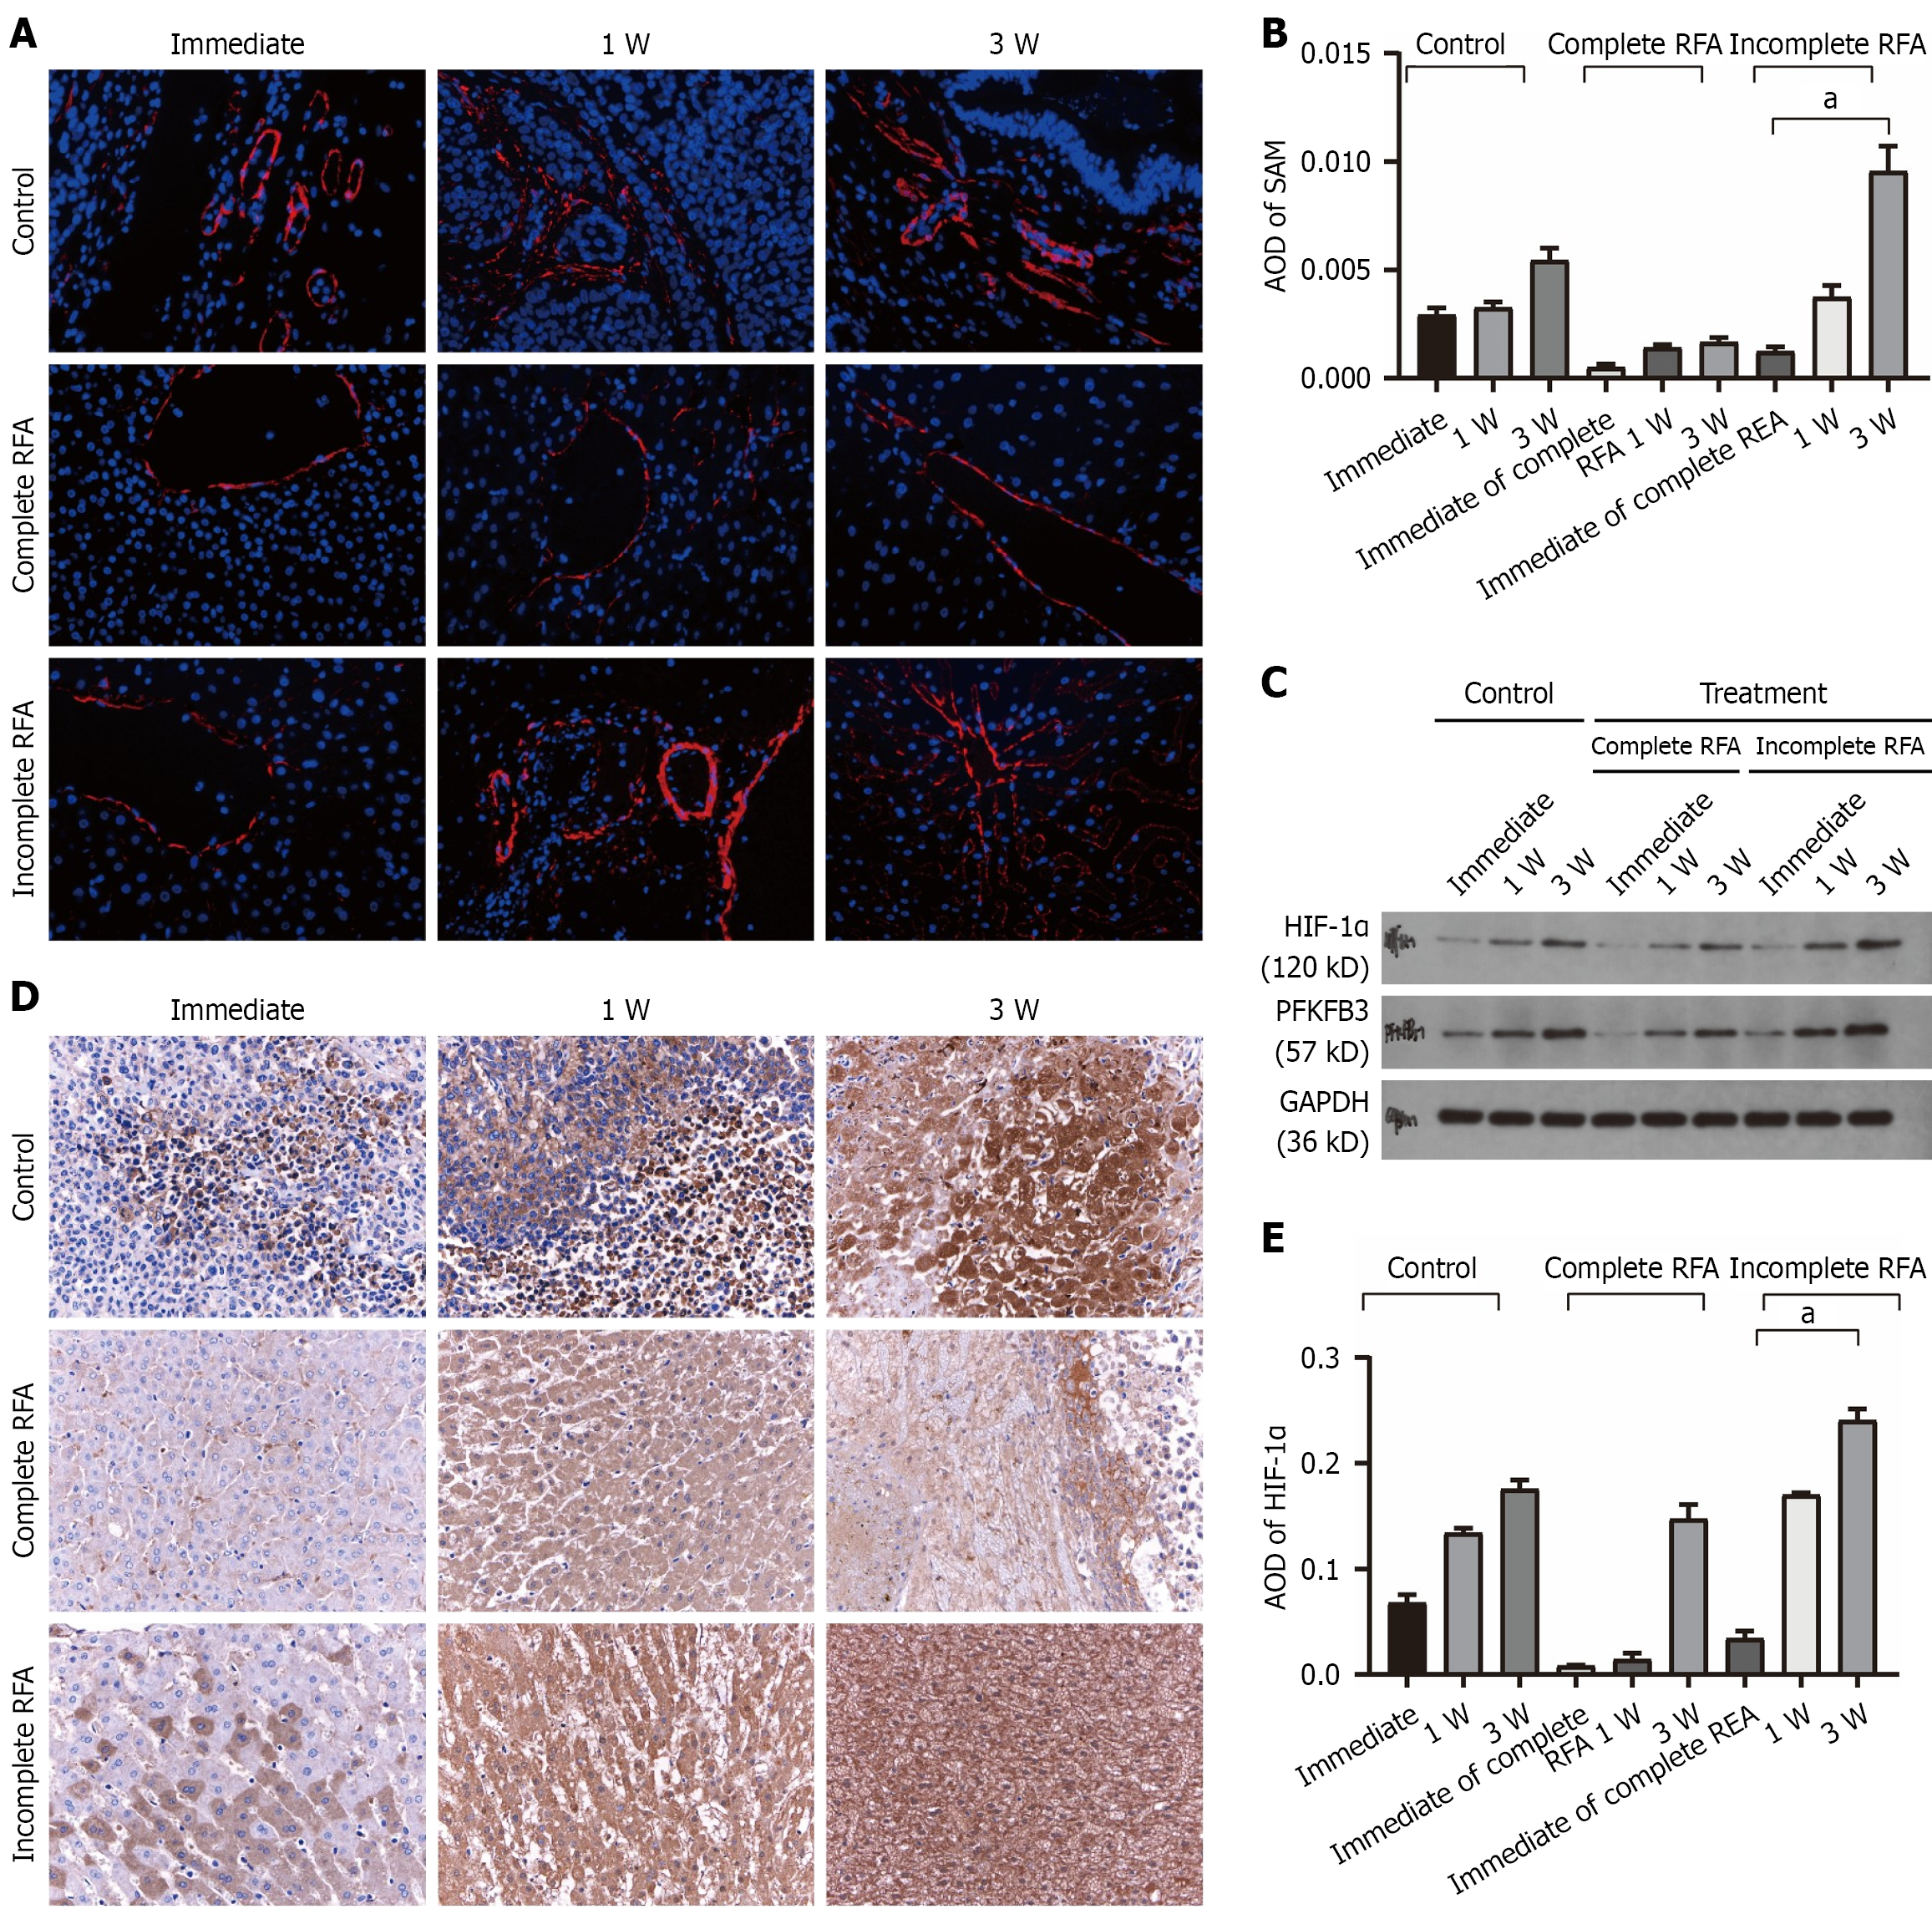
Figure 5 Angiogenesis, glycolytic signaling, and protein expression in rabbit VX2 liver tumors after complete or incomplete radio
- Citation: Lu D, Wang LJ, Chai J, Jiang J, Tang YL. MicroRNA-206 suppresses hypoxia-inducible factor-1α/PFKFB3-mediated glycolysis to inhibit recurrence and metastasis of hepatocellular carcinoma after incomplete radiofrequency ablation. World J Gastrointest Oncol 2026; 18(4): 116104
- URL: https://www.wjgnet.com/1948-5204/full/v18/i4/116104.htm
- DOI: https://dx.doi.org/10.4251/wjgo.v18.i4.116104