
















Copyright: ©Author(s) 2026.
World J Gastrointest Oncol. Apr 15, 2026; 18(4): 116097
Published online Apr 15, 2026. doi: 10.4251/wjgo.v18.i4.116097
Published online Apr 15, 2026. doi: 10.4251/wjgo.v18.i4.116097
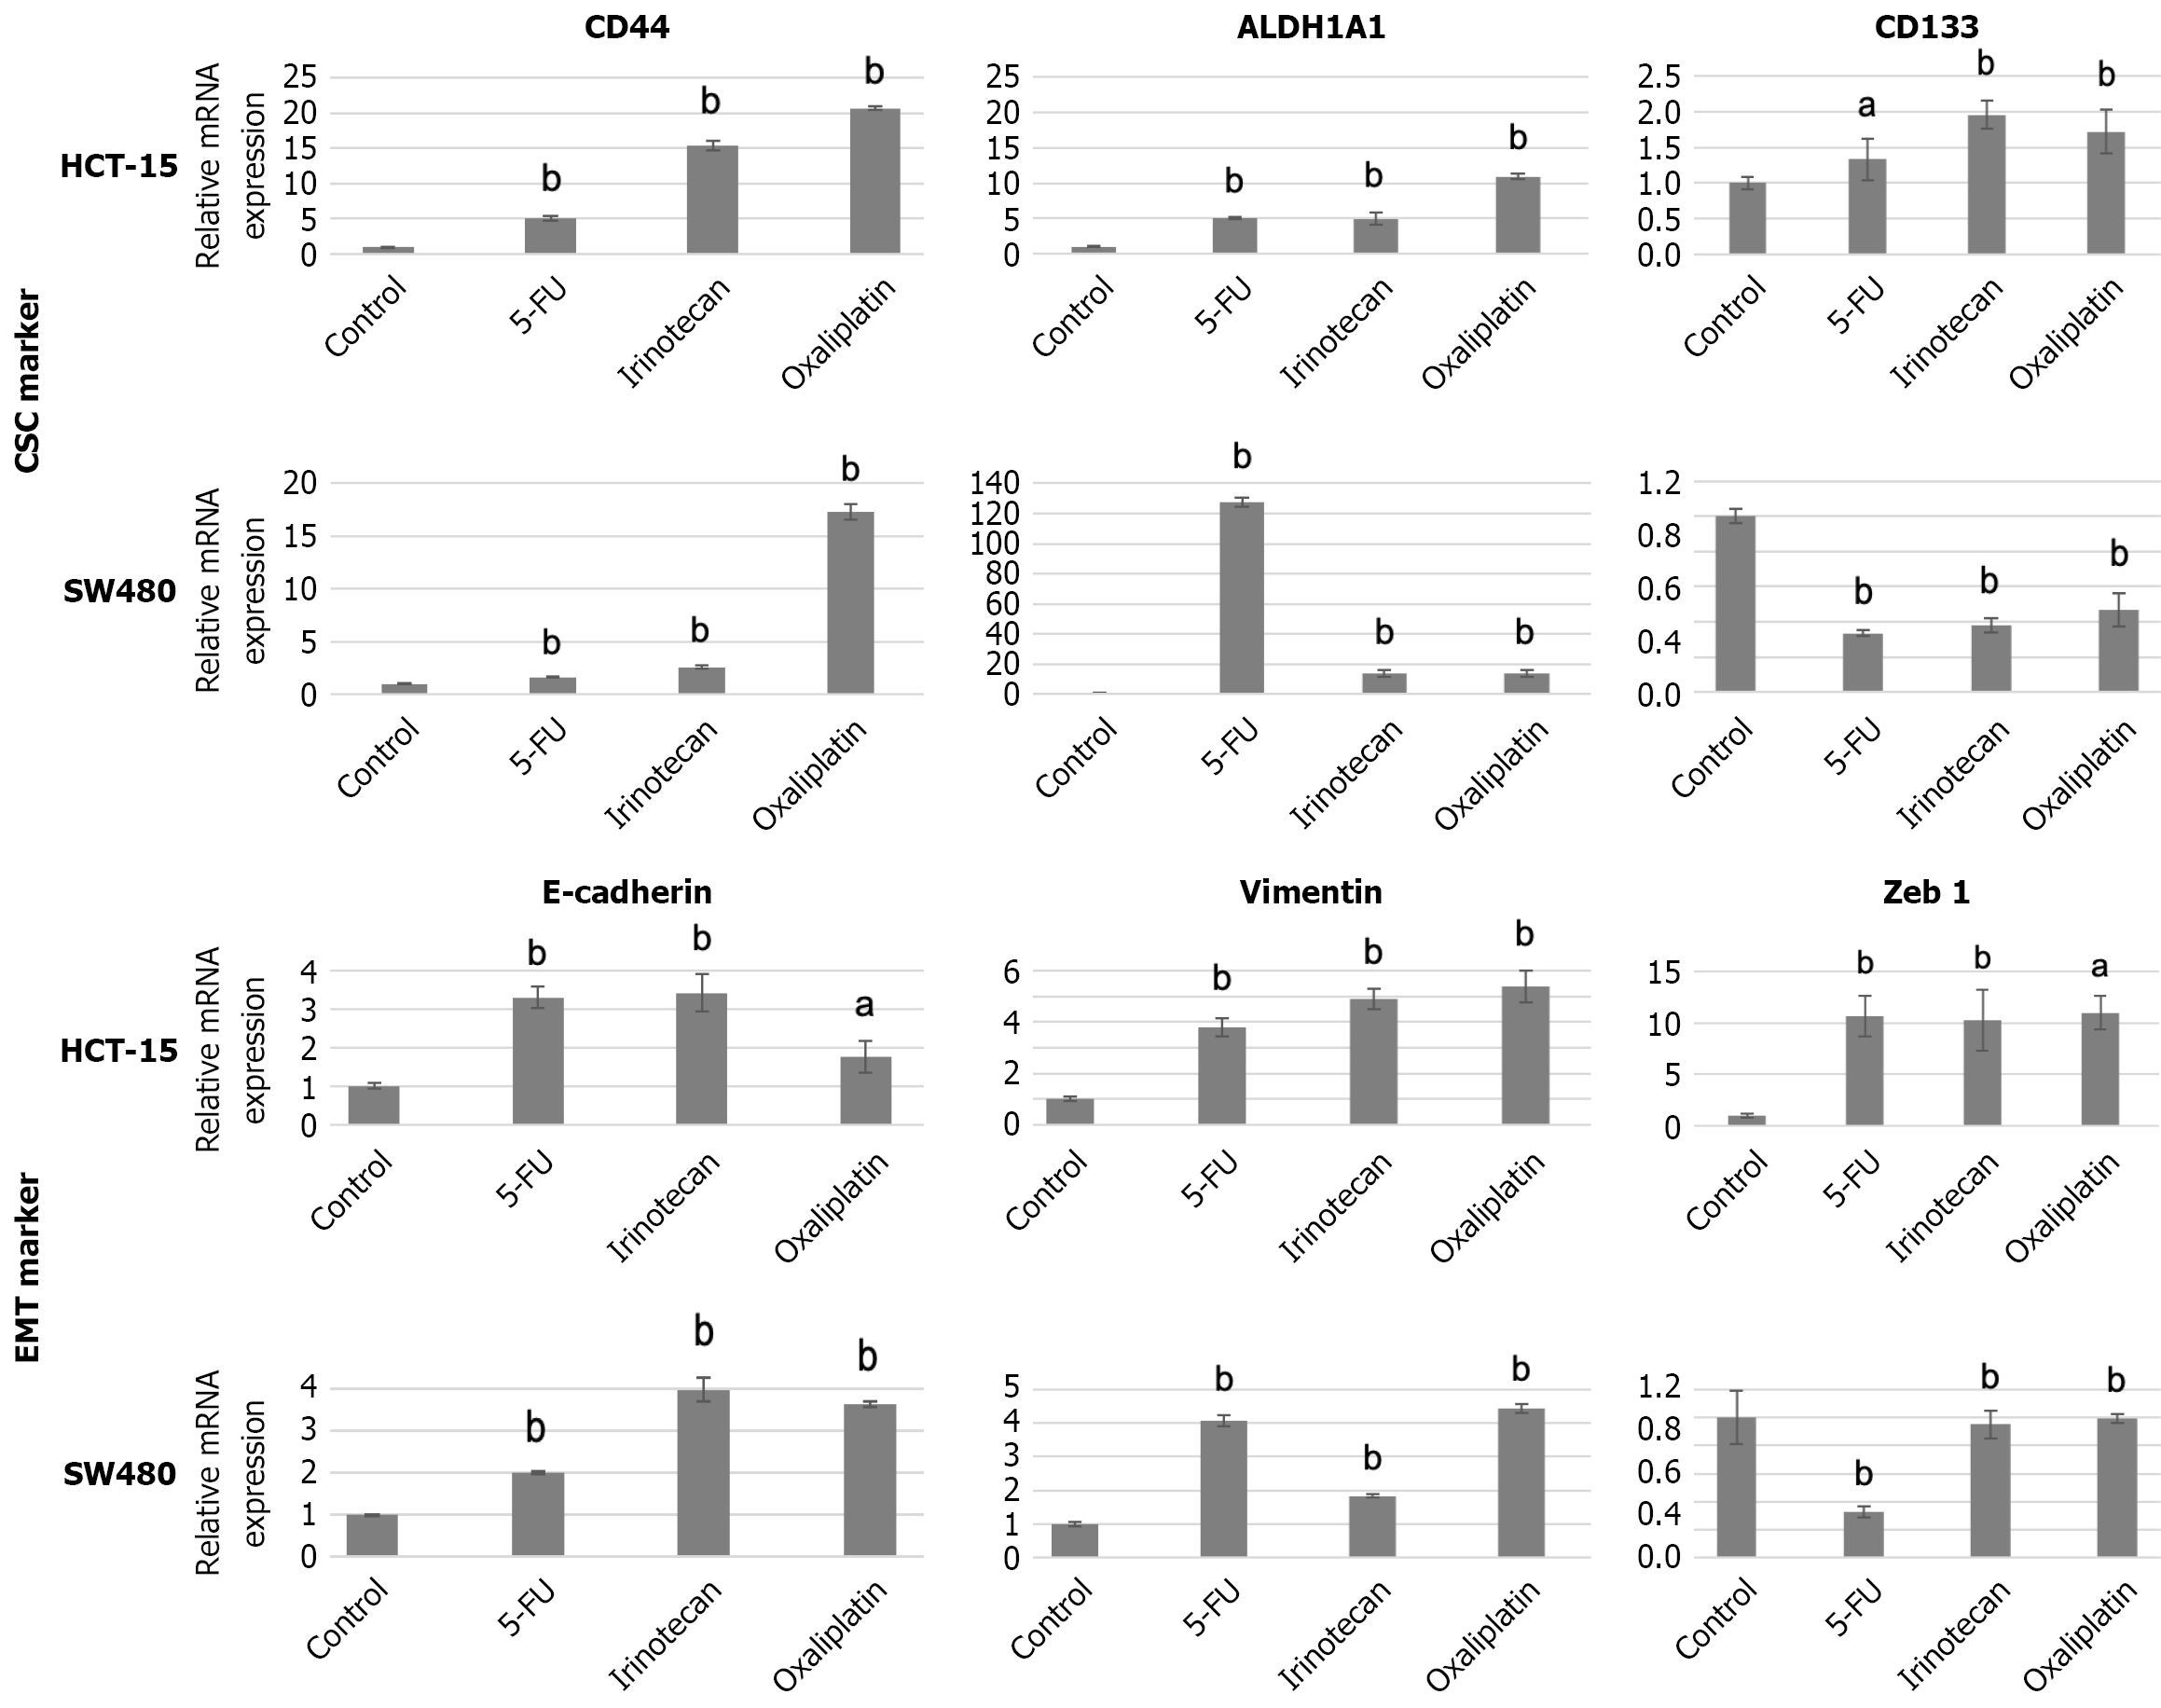
Figure 9 Quantitative reverse transcriptase PCR analysis of cancer stem cell and epithelial-mesenchymal transition markers on colorectal adenocarcinoma spheres.
HCT-15 and SW480 cells were cultured in 96-well low-attachment plates, and anticancer drugs (30 μM) were added on day 3. Total RNA was extracted on day 7 post-treatment, and quantitative reverse transcriptase PCR was performed to assess the expressions of cancer stem cell markers (CD44, ALDH1A1, and PROM1) and epithelial-mesenchymal transition markers (CDH1, VIM, and ZEB1). Gene expression levels were normalized to GAPDH and expressed relative to the control group (set to 1.0). Data represent the means ± SD from three independent experiments, each analyzed in duplicate (biological replicates, n = 3). aP < 0.001 vs control group; bP < 0.0001 vs control group. 5-FU: 5-fluorouracil; CSC: Cancer stem cell; EMT: Epithelial-mesenchymal transition.
- Citation: Yoshimura Y, Shinji S, Ogawa Y, Yamada T, Matsuda A, Uehara K, Yokoyama Y, Takahashi G, Iwai T, Miyasaka T, Kanaka S, Matsui T, Hayashi K, Fujiwara M, Shichi Y, Arai T, Ishiwata T, Yoshida H. Morphological and functional responses of three-dimensional-cultured colorectal cancer spheres to anticancer drugs. World J Gastrointest Oncol 2026; 18(4): 116097
- URL: https://www.wjgnet.com/1948-5204/full/v18/i4/116097.htm
- DOI: https://dx.doi.org/10.4251/wjgo.v18.i4.116097