
















Copyright: ©Author(s) 2026.
World J Gastrointest Oncol. Apr 15, 2026; 18(4): 115635
Published online Apr 15, 2026. doi: 10.4251/wjgo.v18.i4.115635
Published online Apr 15, 2026. doi: 10.4251/wjgo.v18.i4.115635
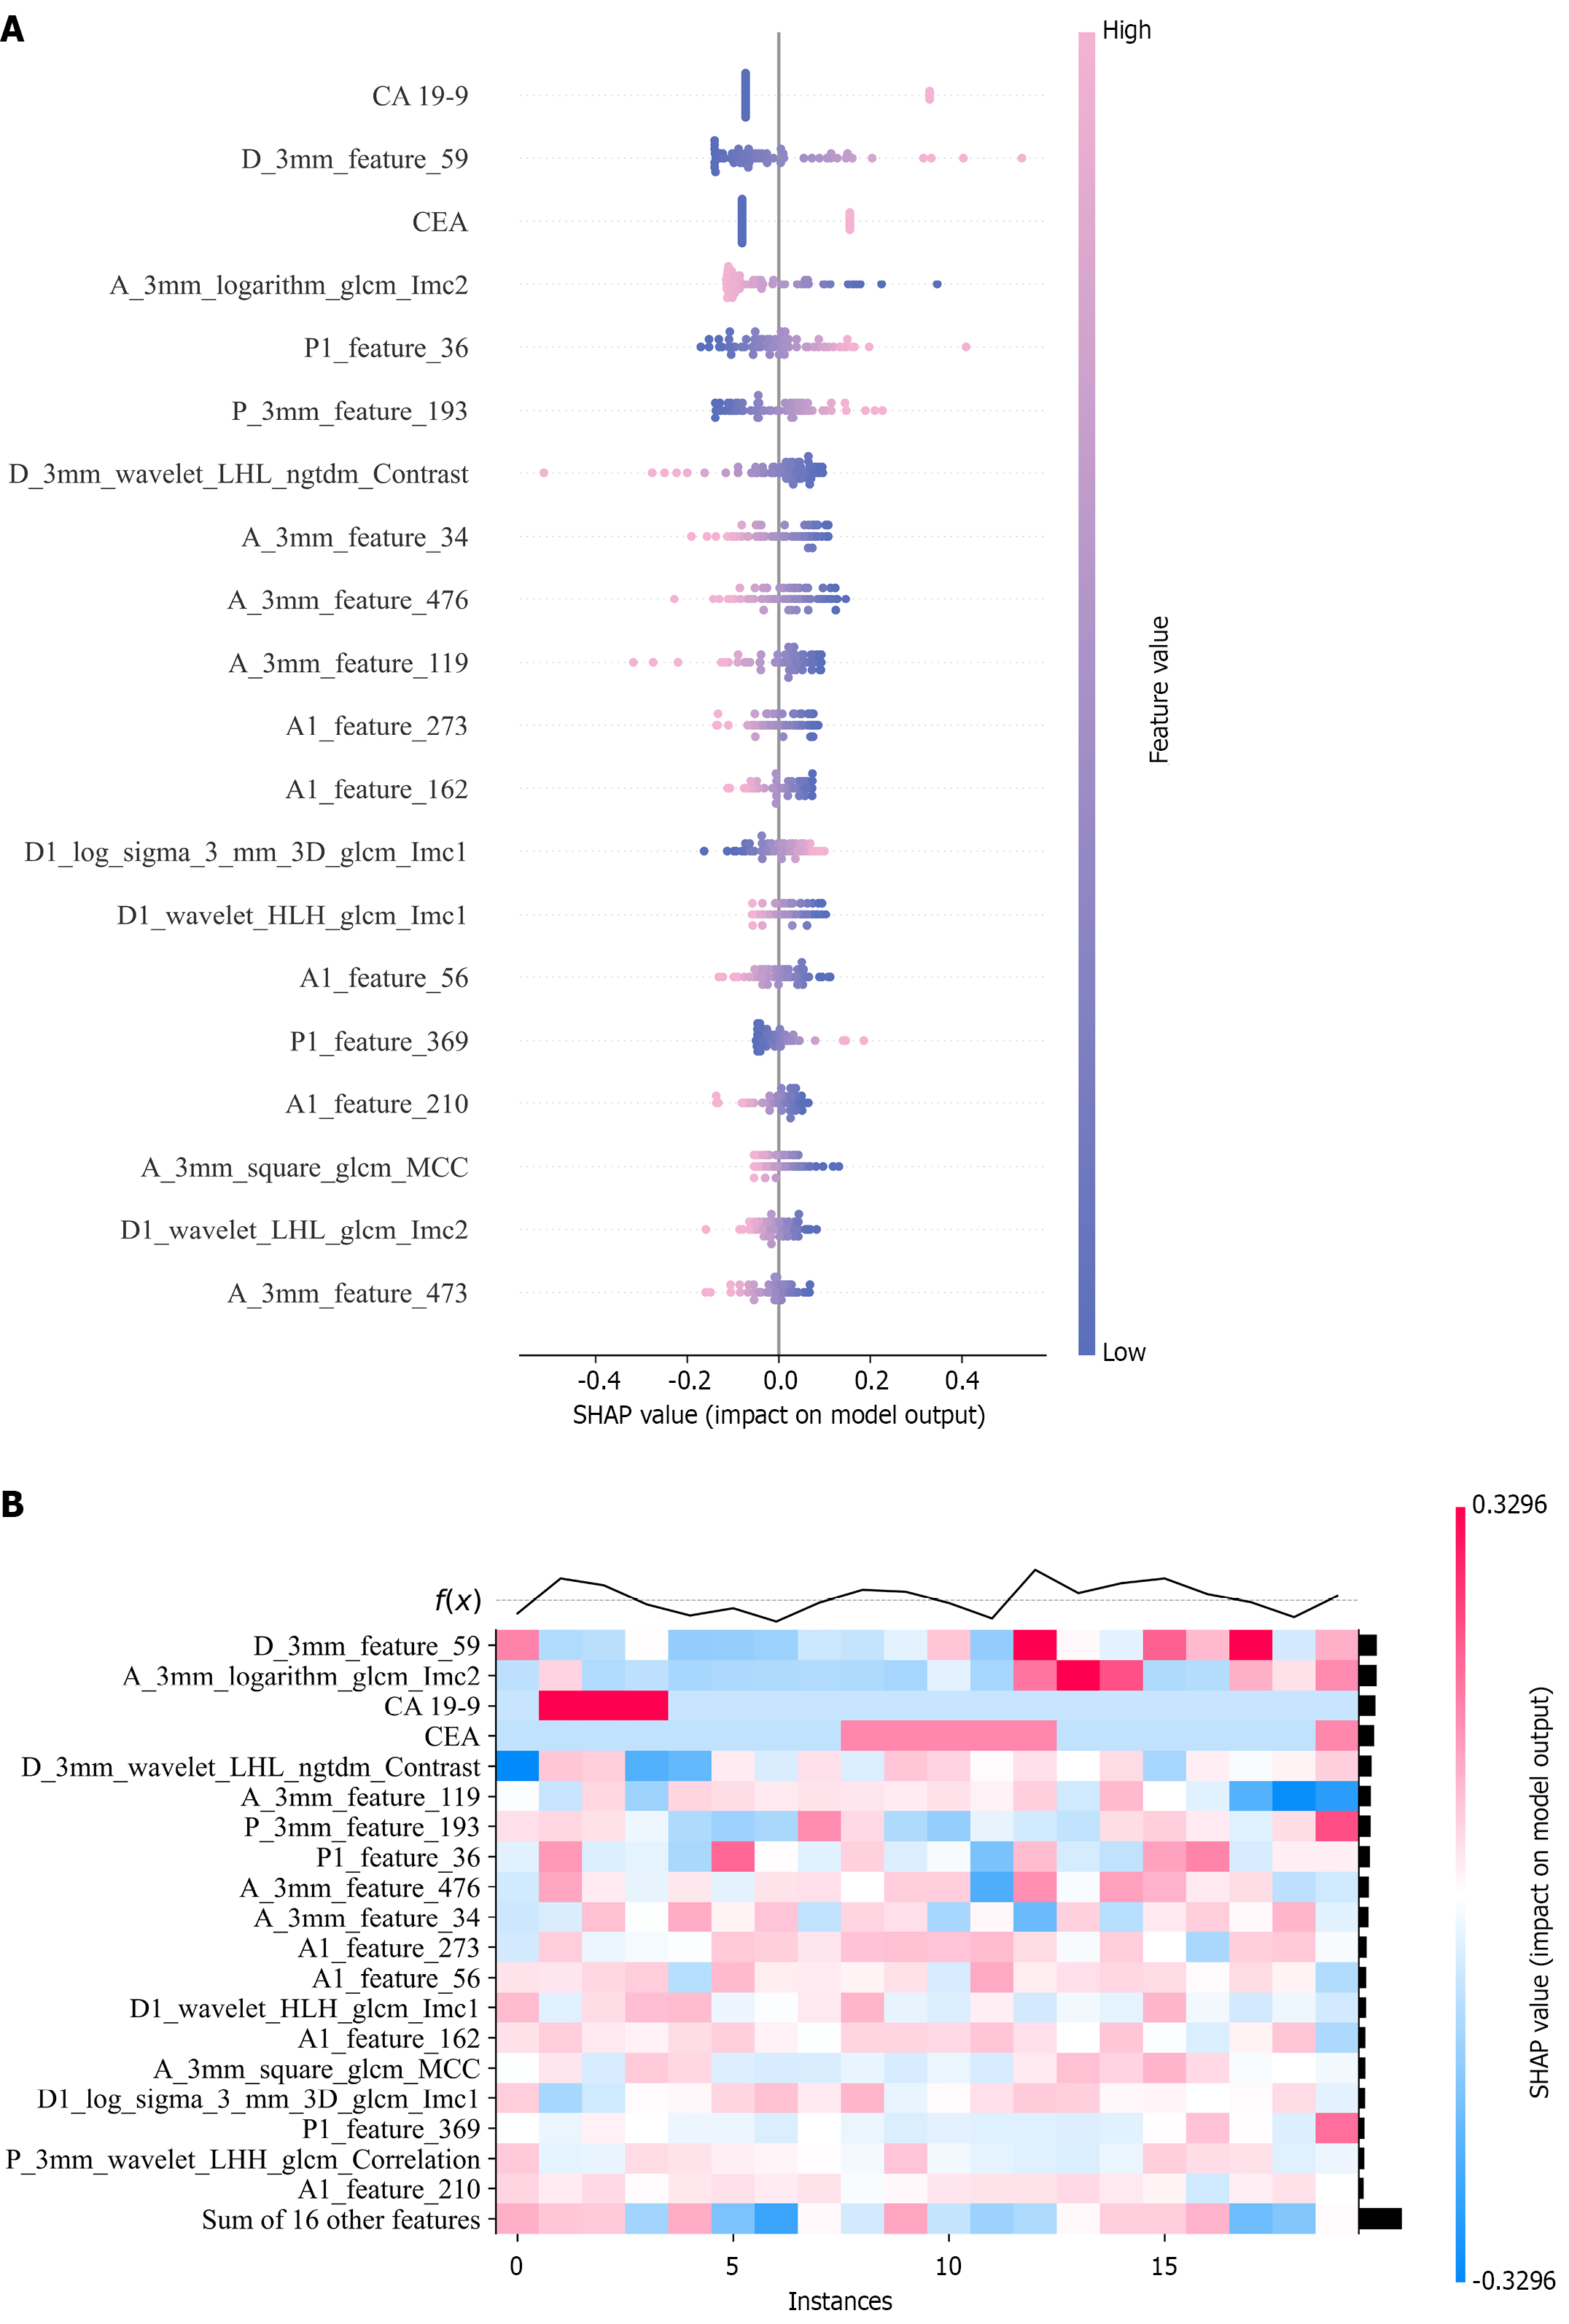
Figure 8 Global model explanation by the SHapley Additive exPlanation method.
A: The SHapley Additive exPlanation beeswarm plot shows the positive or negative effects of each feature on the prediction probability through red and blue colors; B: The SHapley Additive exPlanation heatmap plot shows the direction and intensity of influence for each feature of all cases in the model. SHAP: SHapley Additive exPlanation; CA 19-9: Carbohydrate antigen 19-9; CEA: Carcinoembryonic antigen.
- Citation: Lei XD, Qian GX, Sun ZG, Tang ZQ, Liu YC, Du R, Li YH. Deep learning radiomics nomogram based on multi-regional features for predicting lymph node metastasis and prognosis in colorectal cancer. World J Gastrointest Oncol 2026; 18(4): 115635
- URL: https://www.wjgnet.com/1948-5204/full/v18/i4/115635.htm
- DOI: https://dx.doi.org/10.4251/wjgo.v18.i4.115635