
















Copyright: ©Author(s) 2026.
World J Gastrointest Oncol. Mar 15, 2026; 18(3): 116567
Published online Mar 15, 2026. doi: 10.4251/wjgo.v18.i3.116567
Published online Mar 15, 2026. doi: 10.4251/wjgo.v18.i3.116567
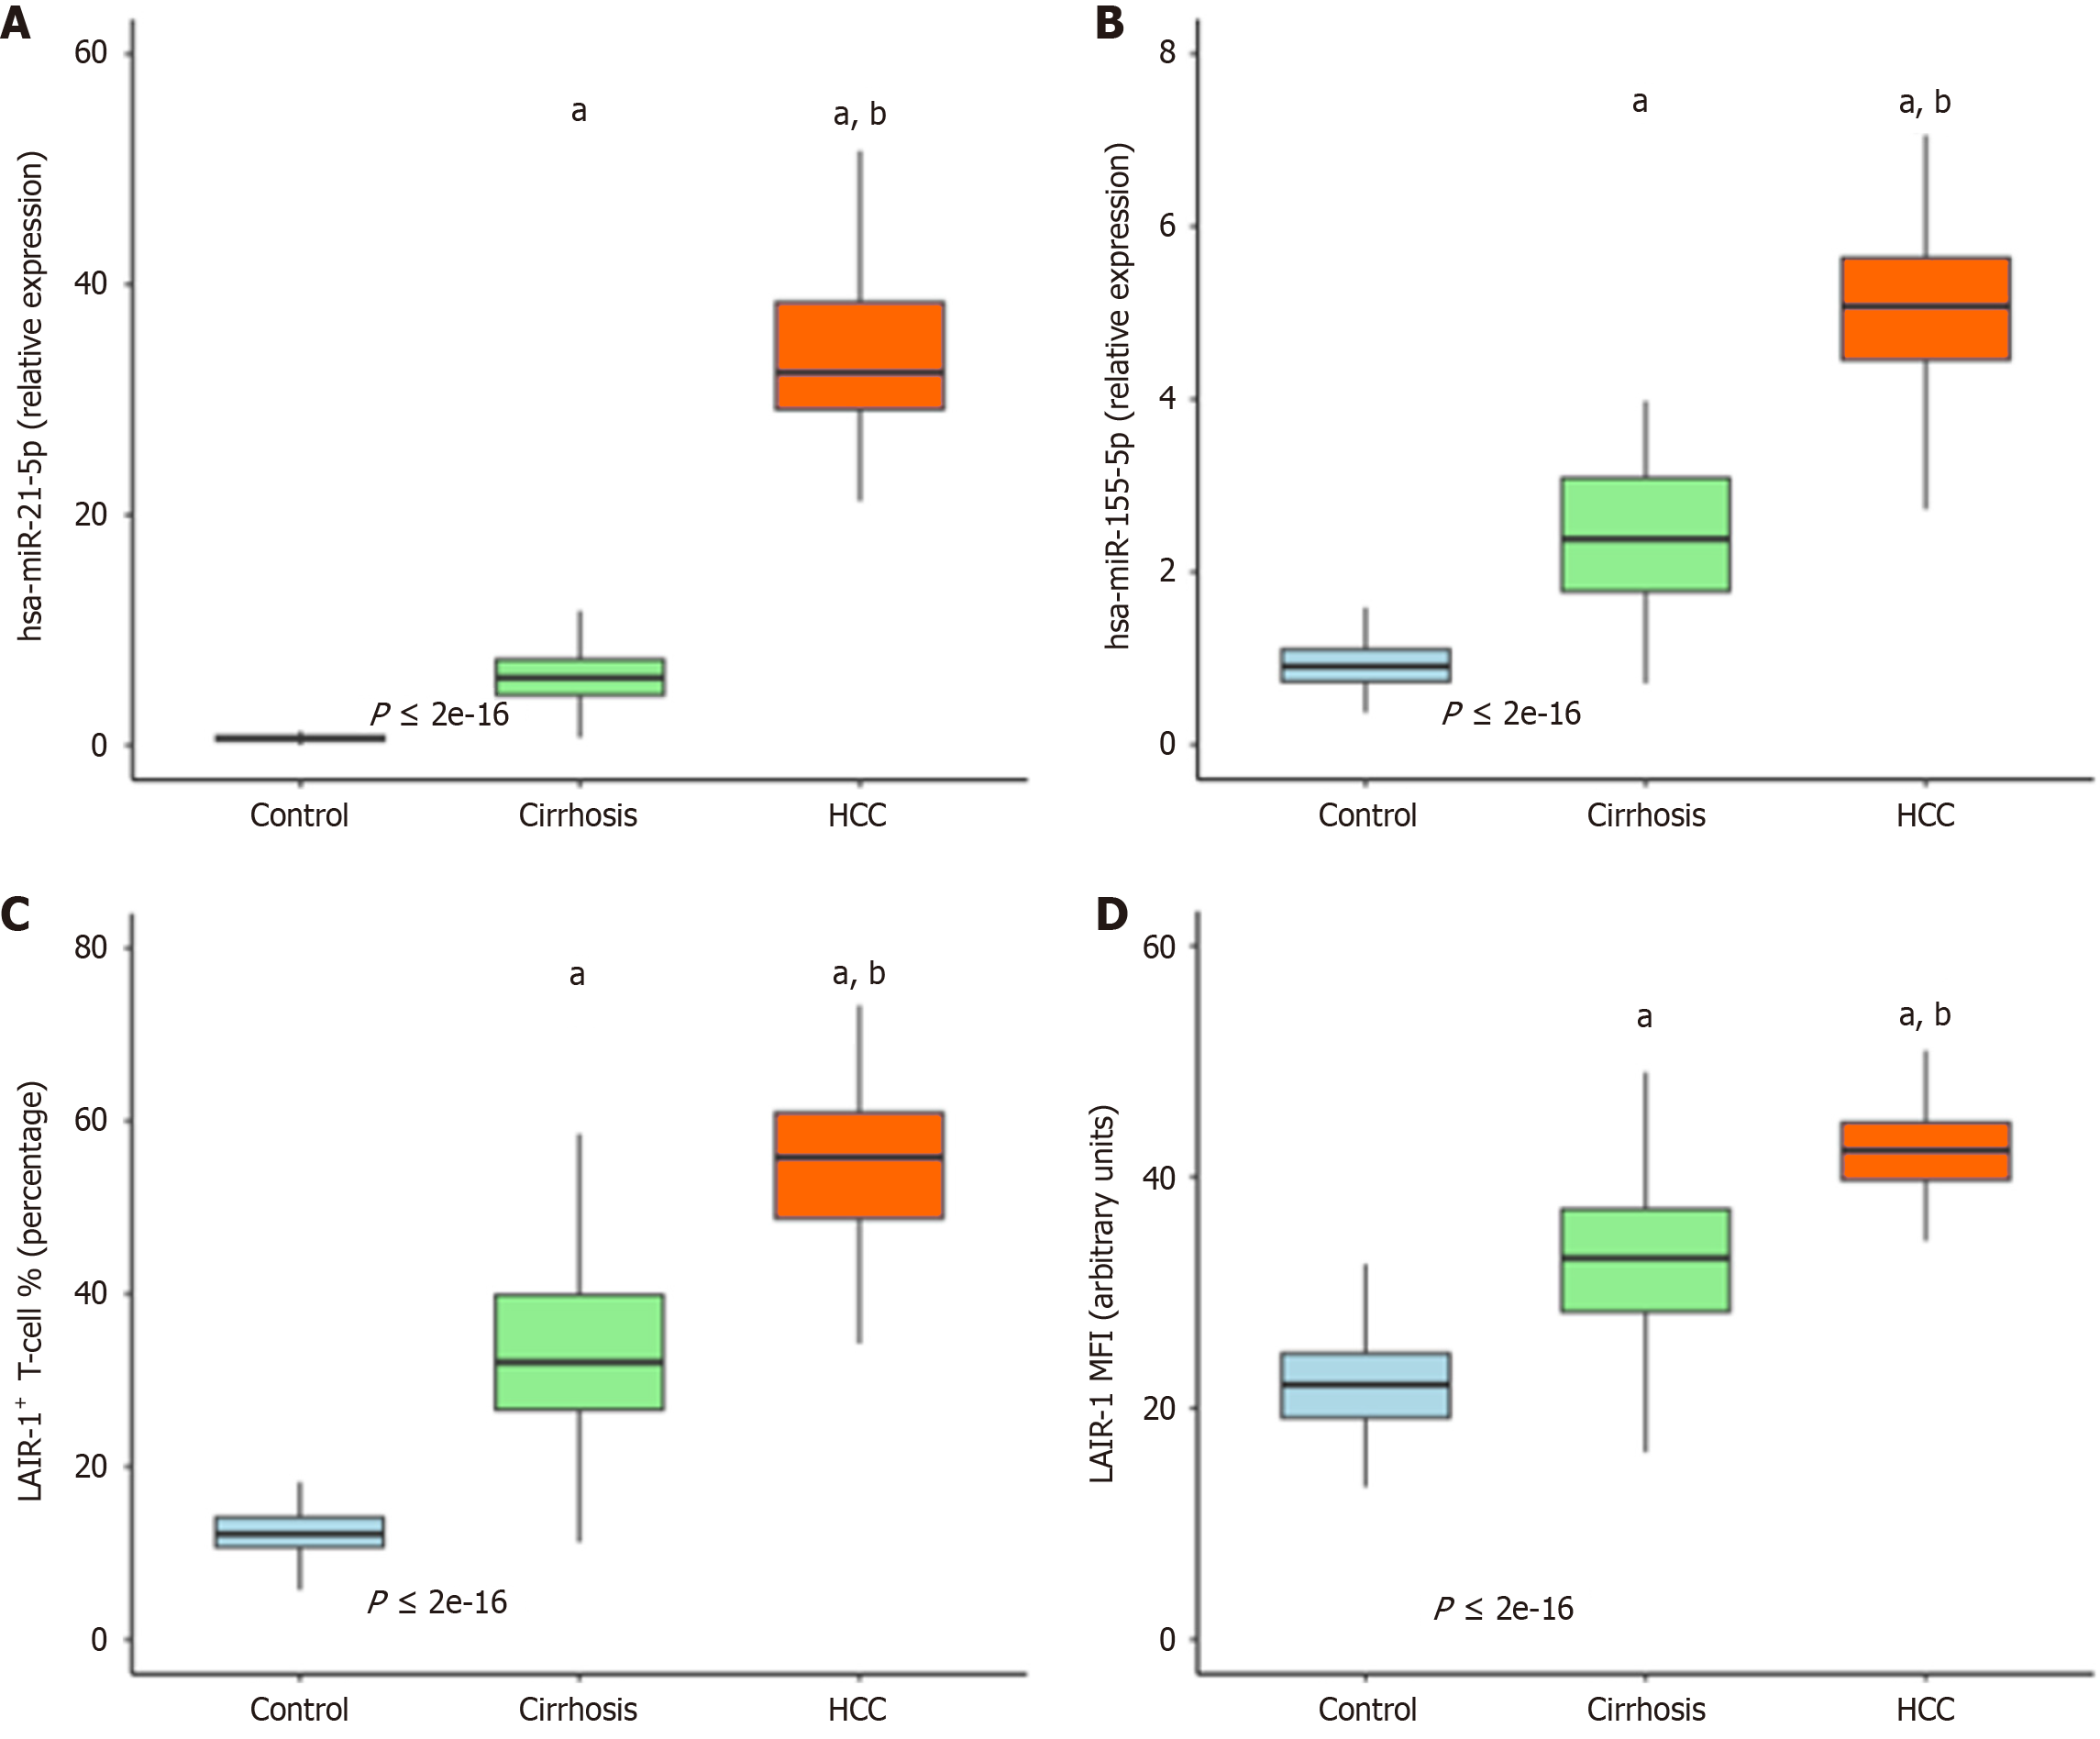
Figure 1 Plasma microRNA and leukocyte-associated immunoglobulin-like receptor-1 mean fluorescence intensity expression levels across study groups.
A: Hsa-miR-21-5p; B: Hsa-miR-155-5p; C: The percentage of leukocyte-associated immunoglobulin-like receptor-1 (LAIR-1)+ T cells (LAIR-1+ TC %); D: LAIR-1 mean fluorescence intensity in healthy controls (n = 81), patients with cirrhosis (n = 60), and patients with hepatocellular carcinoma (HCC, n = 70). The box represents the interquartile range, the line inside the box is the median, and the whiskers extend to the minimum and maximum values. P < 0.001 for Kruskal-Wallis test for all biomarkers; post hoc analysis with Bonferroni correction confirmed that these differences were statistically significant for all pairwise comparisons (HCC vs cirrhosis, HCC vs control, cirrhosis vs control) for all biomarkers (adjusted P < 0.01 for all comparisons). aP < 0.01 vs control. bP < 0.01 vs cirrhosis group. LAIR-1: Leukocyte-associated immunoglobulin-like receptor-1.
- Citation: Sherief DE, Shehata HH, Nosair N, Othman AAA, Sadaka E, Elgamal R. Dual-parameter liquid biopsy using plasma miR-21-5p and T cell LAIR-1 mean fluorescence intensity for hepatocellular carcinoma diagnosis in a high-risk Egyptian cohort. World J Gastrointest Oncol 2026; 18(3): 116567
- URL: https://www.wjgnet.com/1948-5204/full/v18/i3/116567.htm
- DOI: https://dx.doi.org/10.4251/wjgo.v18.i3.116567