
















Copyright: ©Author(s) 2026.
World J Gastrointest Oncol. Mar 15, 2026; 18(3): 115812
Published online Mar 15, 2026. doi: 10.4251/wjgo.v18.i3.115812
Published online Mar 15, 2026. doi: 10.4251/wjgo.v18.i3.115812
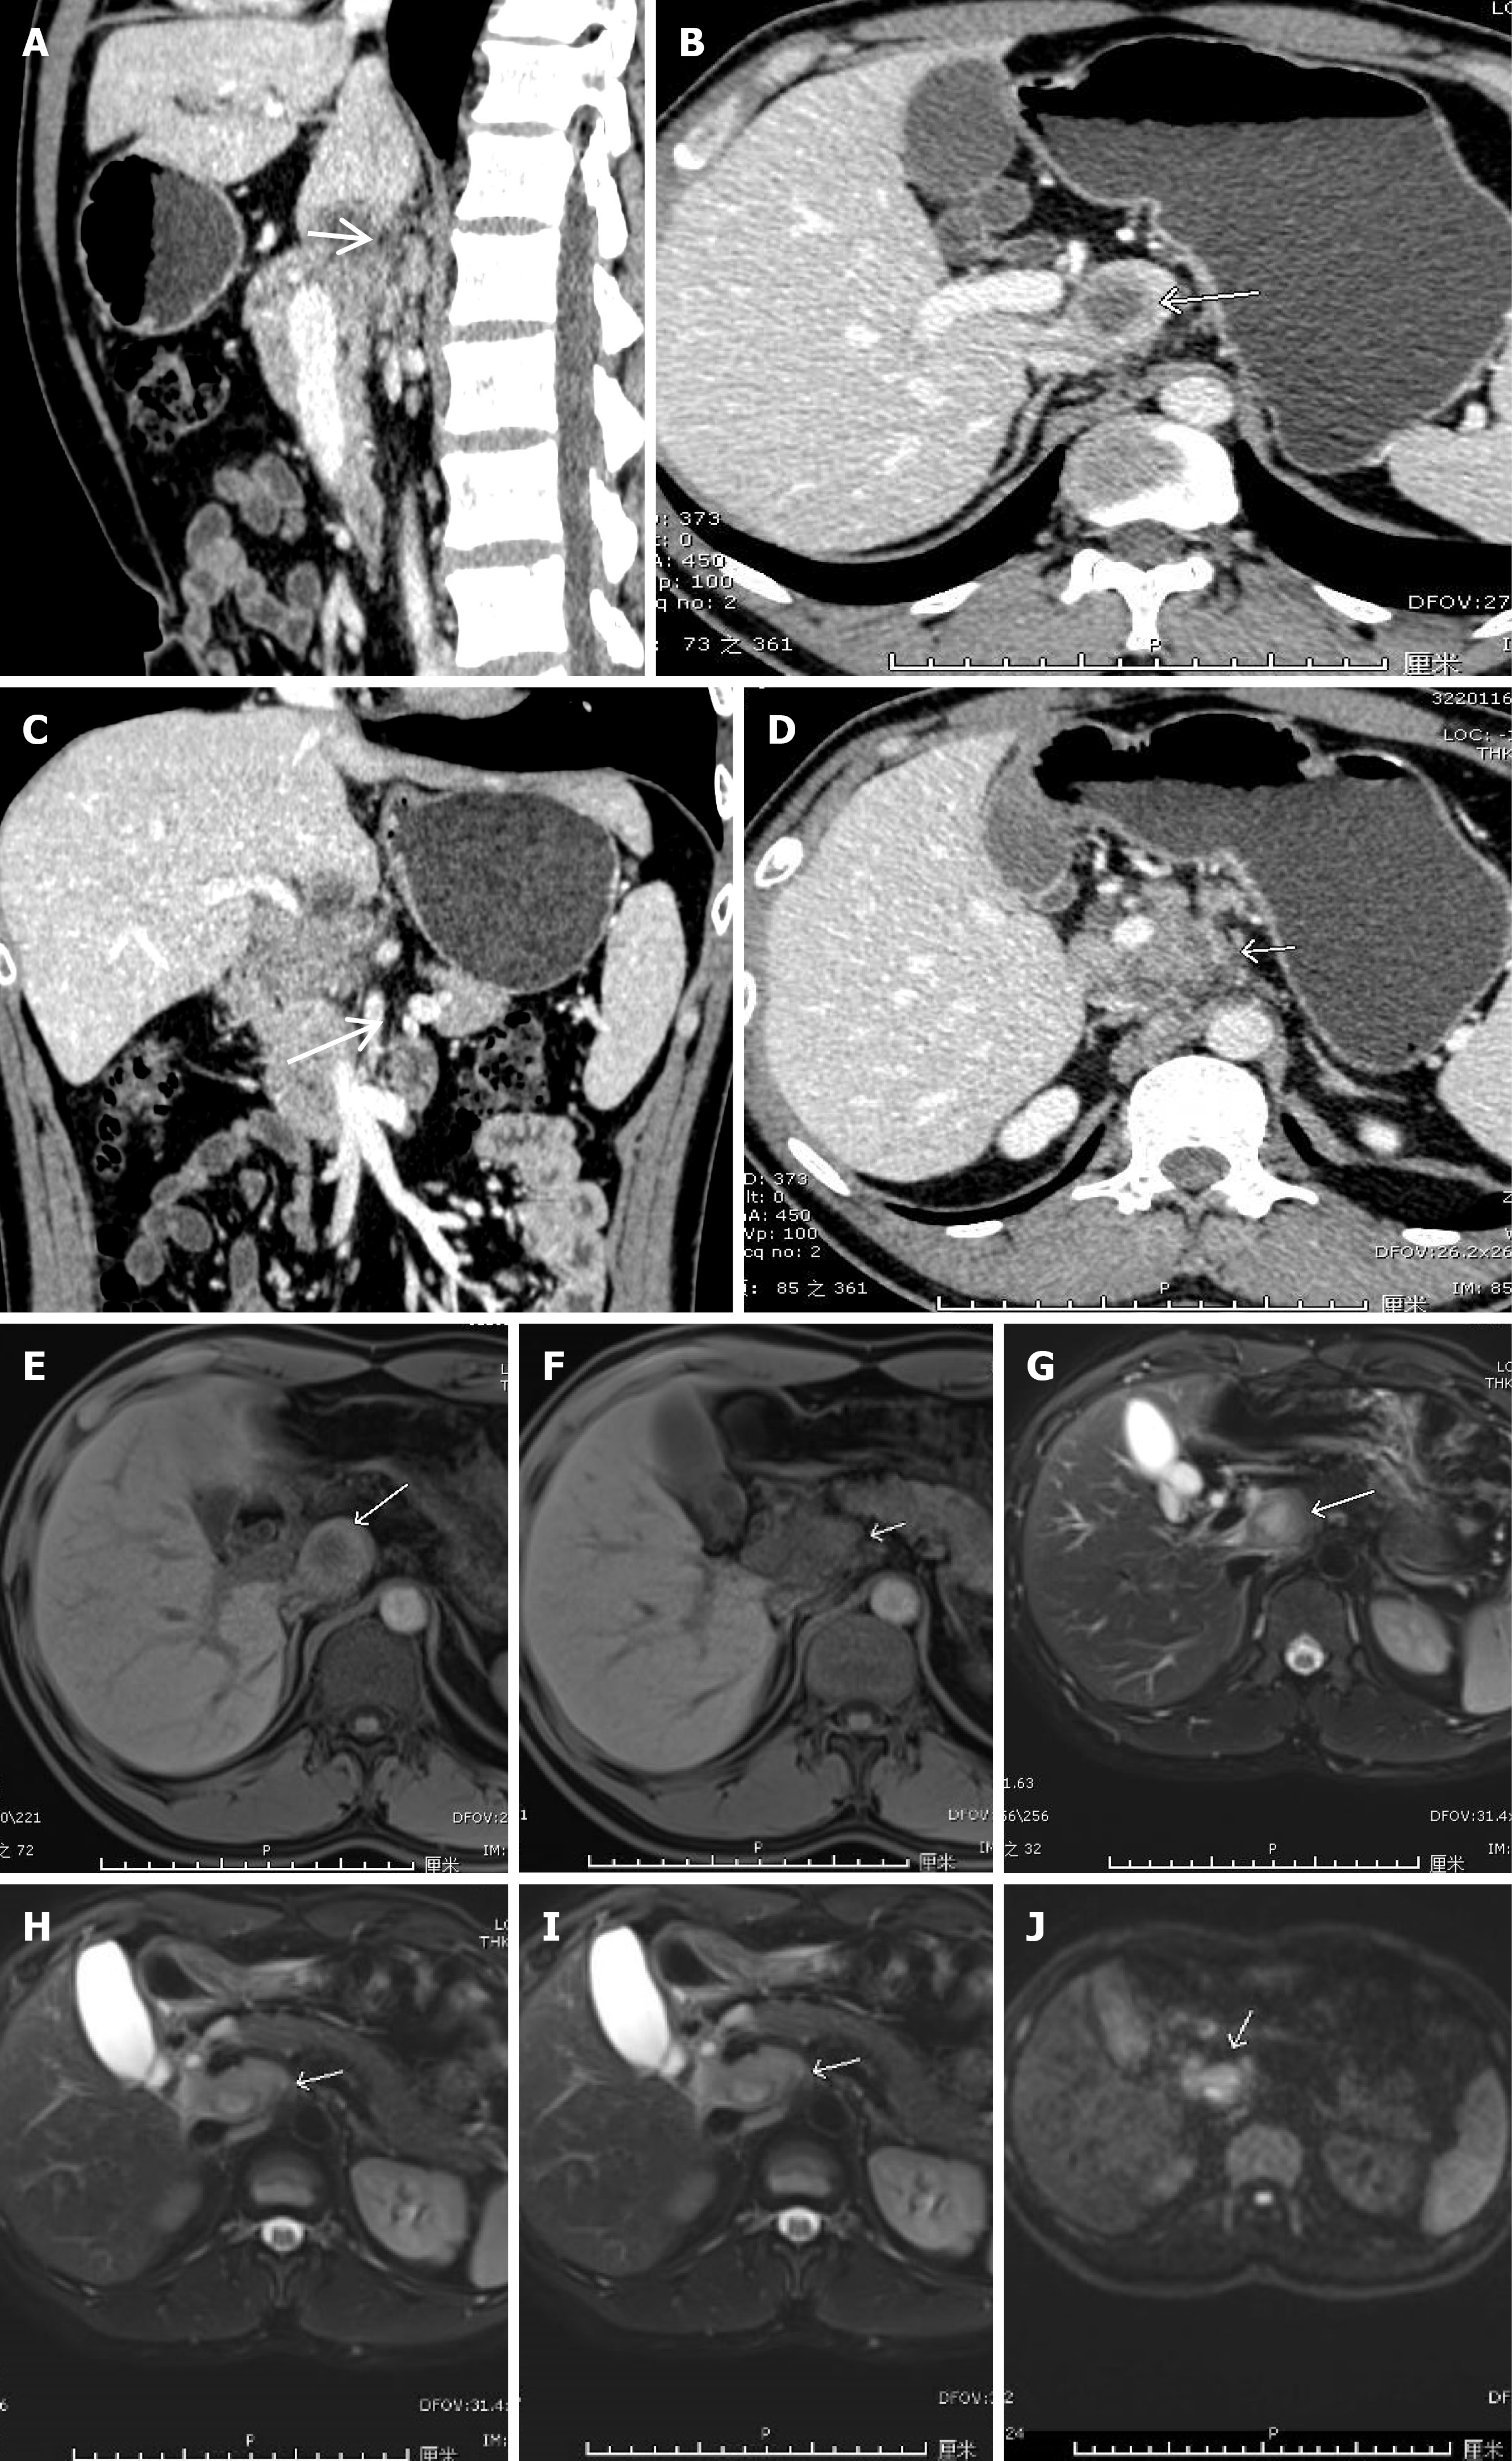
Figure 1 Computed tomography and magnetic resonance imaging images of the liver.
A: Sagittal plane showing lesions in the caudal lobe region (arrow); B: Axial position of lesions in the caudal lobe region (arrow); C: Coronal view showing lesions in the caudal lobe region and enlarged lymph nodes below the caudal lobe (arrow); D: Multiple enlarged lymph nodes in the portal space; E: Lesion in caudal lobe region (T1 sequence) (arrow); F: Multiple enlarged lymph nodes in the portal space on T1 sequence (slightly prolonged T2 signal nodules, partially fused) (arrow); G: Caudal lobe region lesion (T2 sequence); H: Multiple enlarged lymph nodes in the portal space on T2 sequence (slightly prolonged T2 signal nodules, partially fused) (arrow); I: Lesion in the caudal lobe region on the enhanced sequence, appearing as a circular enhancement (coronal plane) (arrow); J: Enlarged lymph nodes in the portal space with high signal intensity on diffusion-weighted imaging (arrow).
- Citation: Qi DY, Zhao YC, Chen LP. Isolated hepatic tuberculoma: A case report and review of the literature. World J Gastrointest Oncol 2026; 18(3): 115812
- URL: https://www.wjgnet.com/1948-5204/full/v18/i3/115812.htm
- DOI: https://dx.doi.org/10.4251/wjgo.v18.i3.115812