
















©The Author(s) 2026.
World J Gastrointest Oncol. Feb 15, 2026; 18(2): 115387
Published online Feb 15, 2026. doi: 10.4251/wjgo.v18.i2.115387
Published online Feb 15, 2026. doi: 10.4251/wjgo.v18.i2.115387
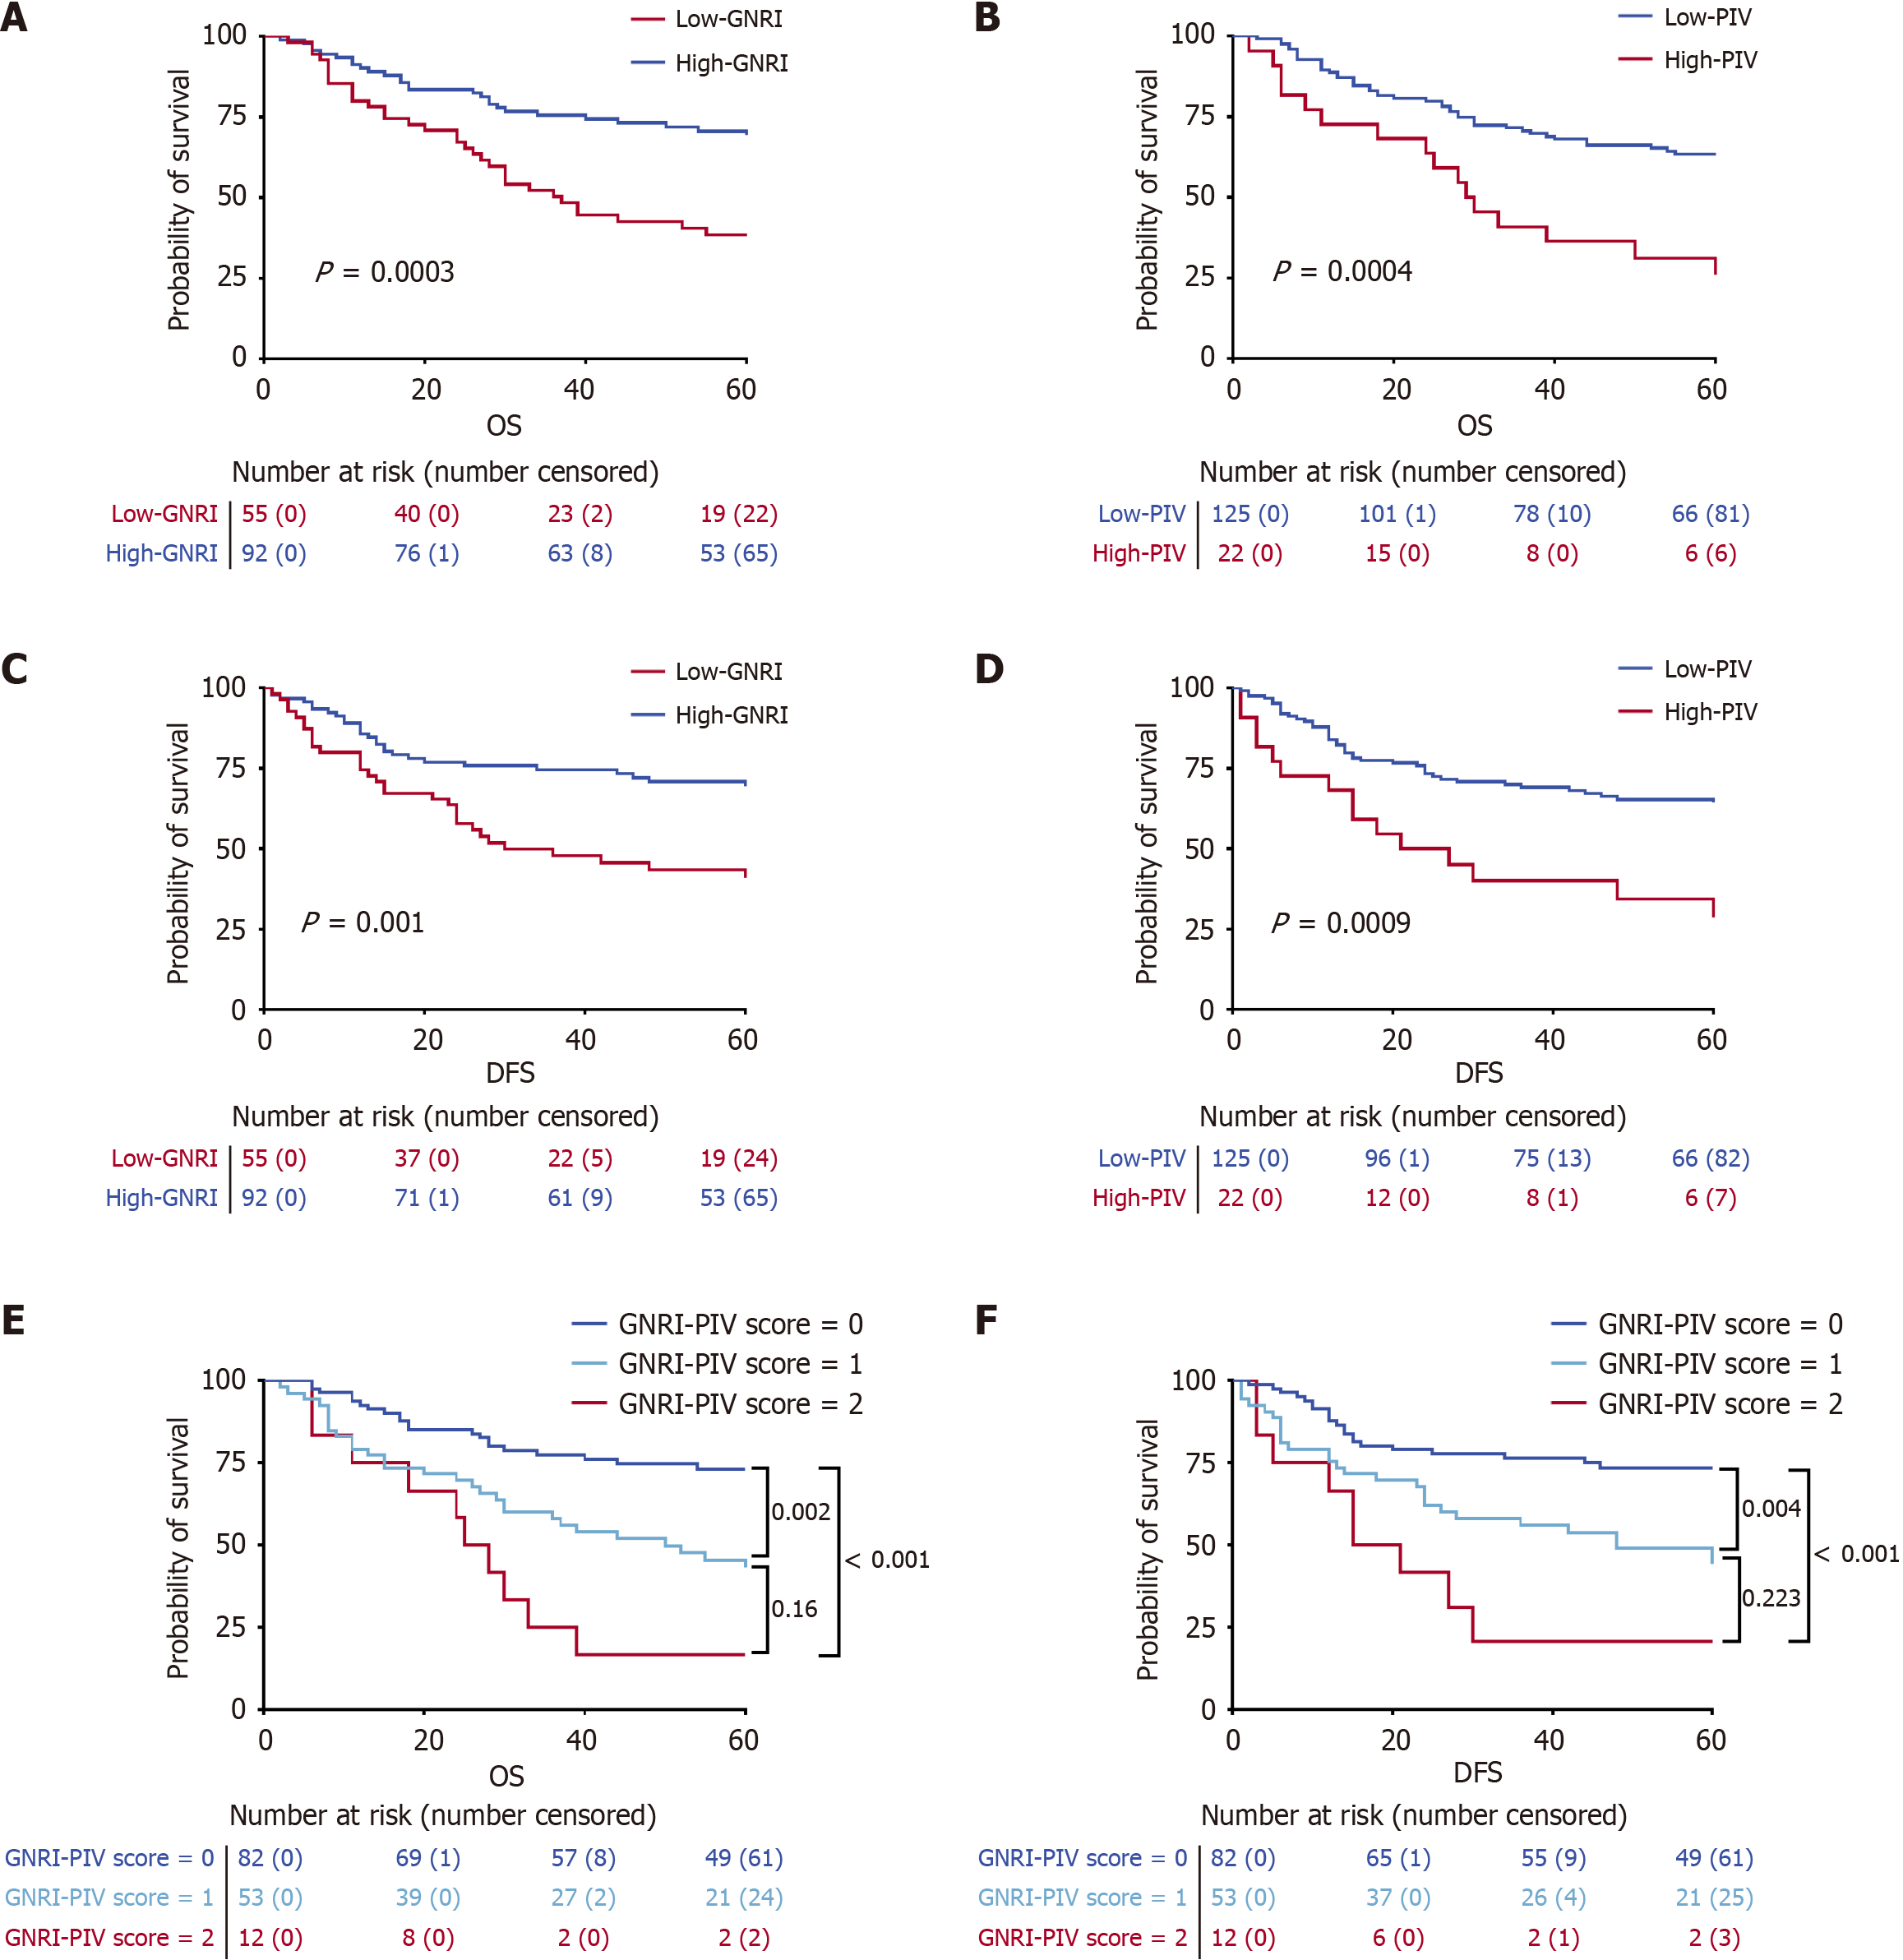
Figure 2 Survival analysis in different group.
A and B: Kaplan-Meier plot lines of overall survival for different geriatric nutritional risk index (GNRI) and pan-immune-inflammation value (PIV) groups; C and D: Disease-free survival for different GNRI and PIV groups; E and F: Overall survival and disease-free survival for different GNRI-PIV score groups. OS: Overall survival; GNRI: Geriatric nutritional risk index; PIV: Pan-immune-inflammation value; DFS: Disease-free survival.
- Citation: Zhong WT, Ding SK, Li RY, Liu CY, Huang HY, Yu JC. Clinical value of geriatric nutritional risk index and pan-immune-inflammation value in locally advanced gastric cancer receiving neoadjuvant chemotherapy. World J Gastrointest Oncol 2026; 18(2): 115387
- URL: https://www.wjgnet.com/1948-5204/full/v18/i2/115387.htm
- DOI: https://dx.doi.org/10.4251/wjgo.v18.i2.115387