
















©The Author(s) 2026.
World J Gastrointest Oncol. Feb 15, 2026; 18(2): 114782
Published online Feb 15, 2026. doi: 10.4251/wjgo.v18.i2.114782
Published online Feb 15, 2026. doi: 10.4251/wjgo.v18.i2.114782
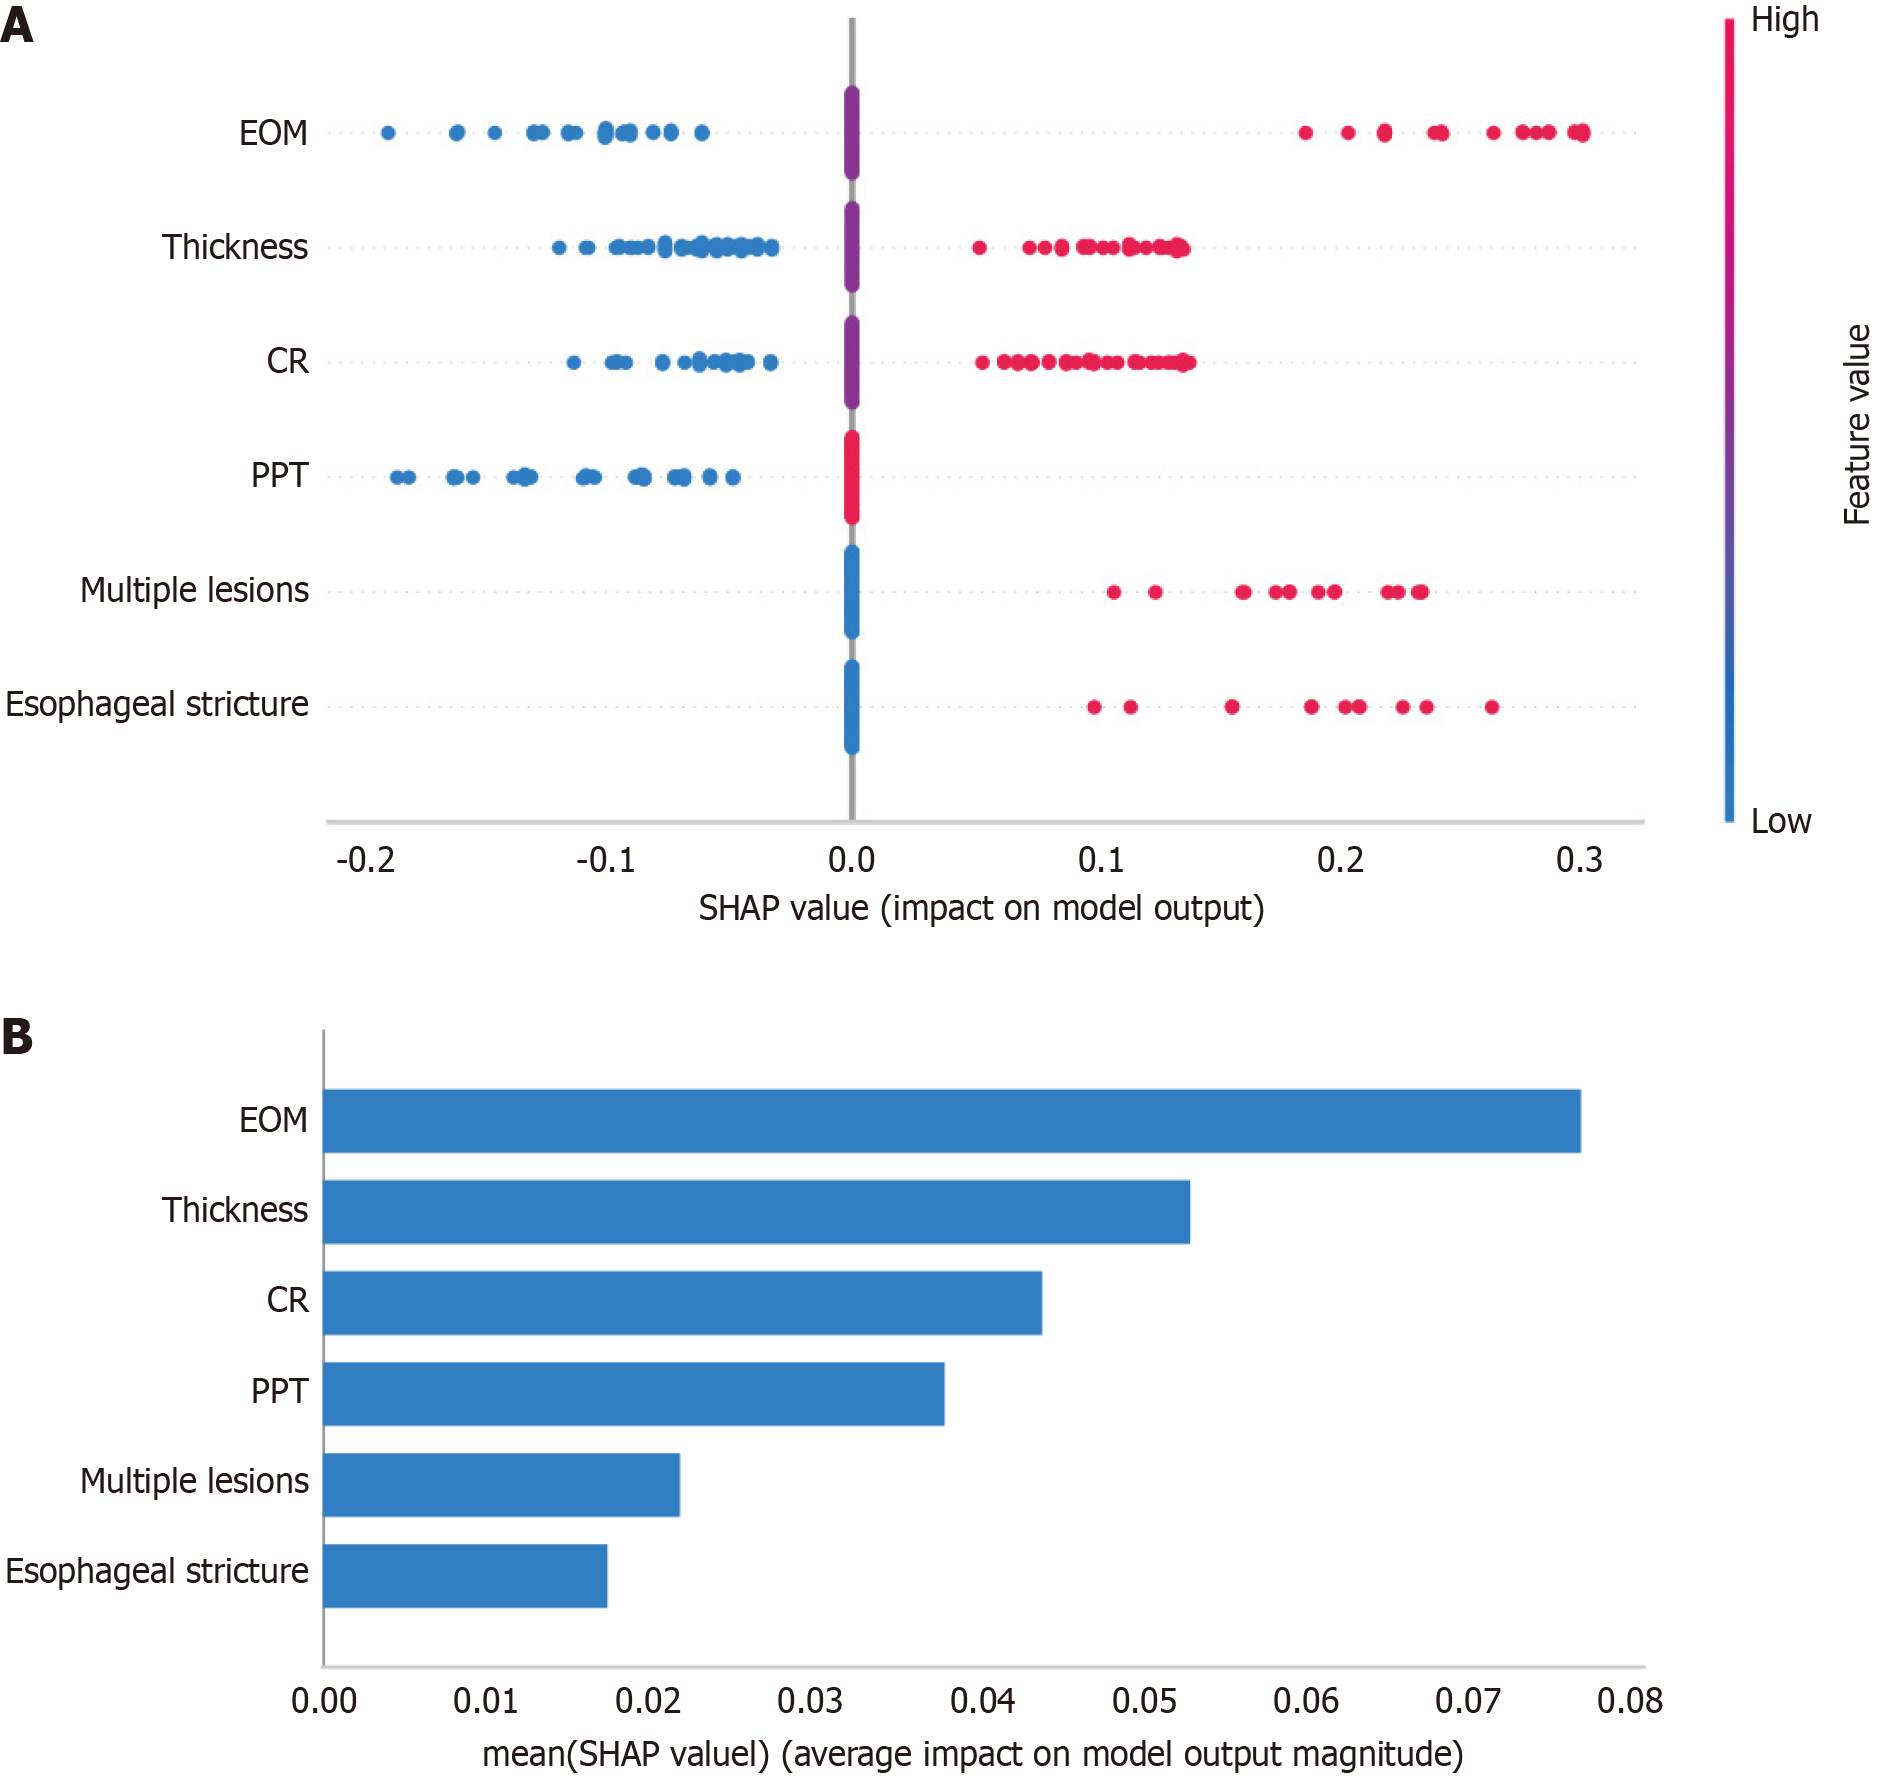
Figure 5 SHapley Additive exPlanations interpretability analysis for the non-curative resection prediction model.
A: Feature contribution summary. The horizontal axis indicates the Shapley Additive exPlanations value (log-odds impact on prediction); the vertical axis lists clinical predictors. Red and blue dots indicate high and low feature values, respectively; B: Predictor importance ranking. Bar length reflects the mean |SHapley Additive exPlanations| value, quantifying each predictor’s contribution to model decisions. SHAP: SHapley Additive exPlanations; CR: Circumferential ratio; EOM: Endoscopic ultrasound or magnifying endoscopy with narrow-band imaging; PPT: Postoperative pathological type.
- Citation: Luo ZC, Guo HY, Tang X, Chen XR, Zhang CY, Cui YT, Zuo J, Li HR, Hou XM, Chen H, Song SB, Wang XF. Predicting the magnitude of risk for non-curative endoscopic submucosal dissection in superficial esophageal cancer using explainable artificial intelligence. World J Gastrointest Oncol 2026; 18(2): 114782
- URL: https://www.wjgnet.com/1948-5204/full/v18/i2/114782.htm
- DOI: https://dx.doi.org/10.4251/wjgo.v18.i2.114782