
















©The Author(s) 2026.
World J Gastrointest Oncol. Feb 15, 2026; 18(2): 114782
Published online Feb 15, 2026. doi: 10.4251/wjgo.v18.i2.114782
Published online Feb 15, 2026. doi: 10.4251/wjgo.v18.i2.114782
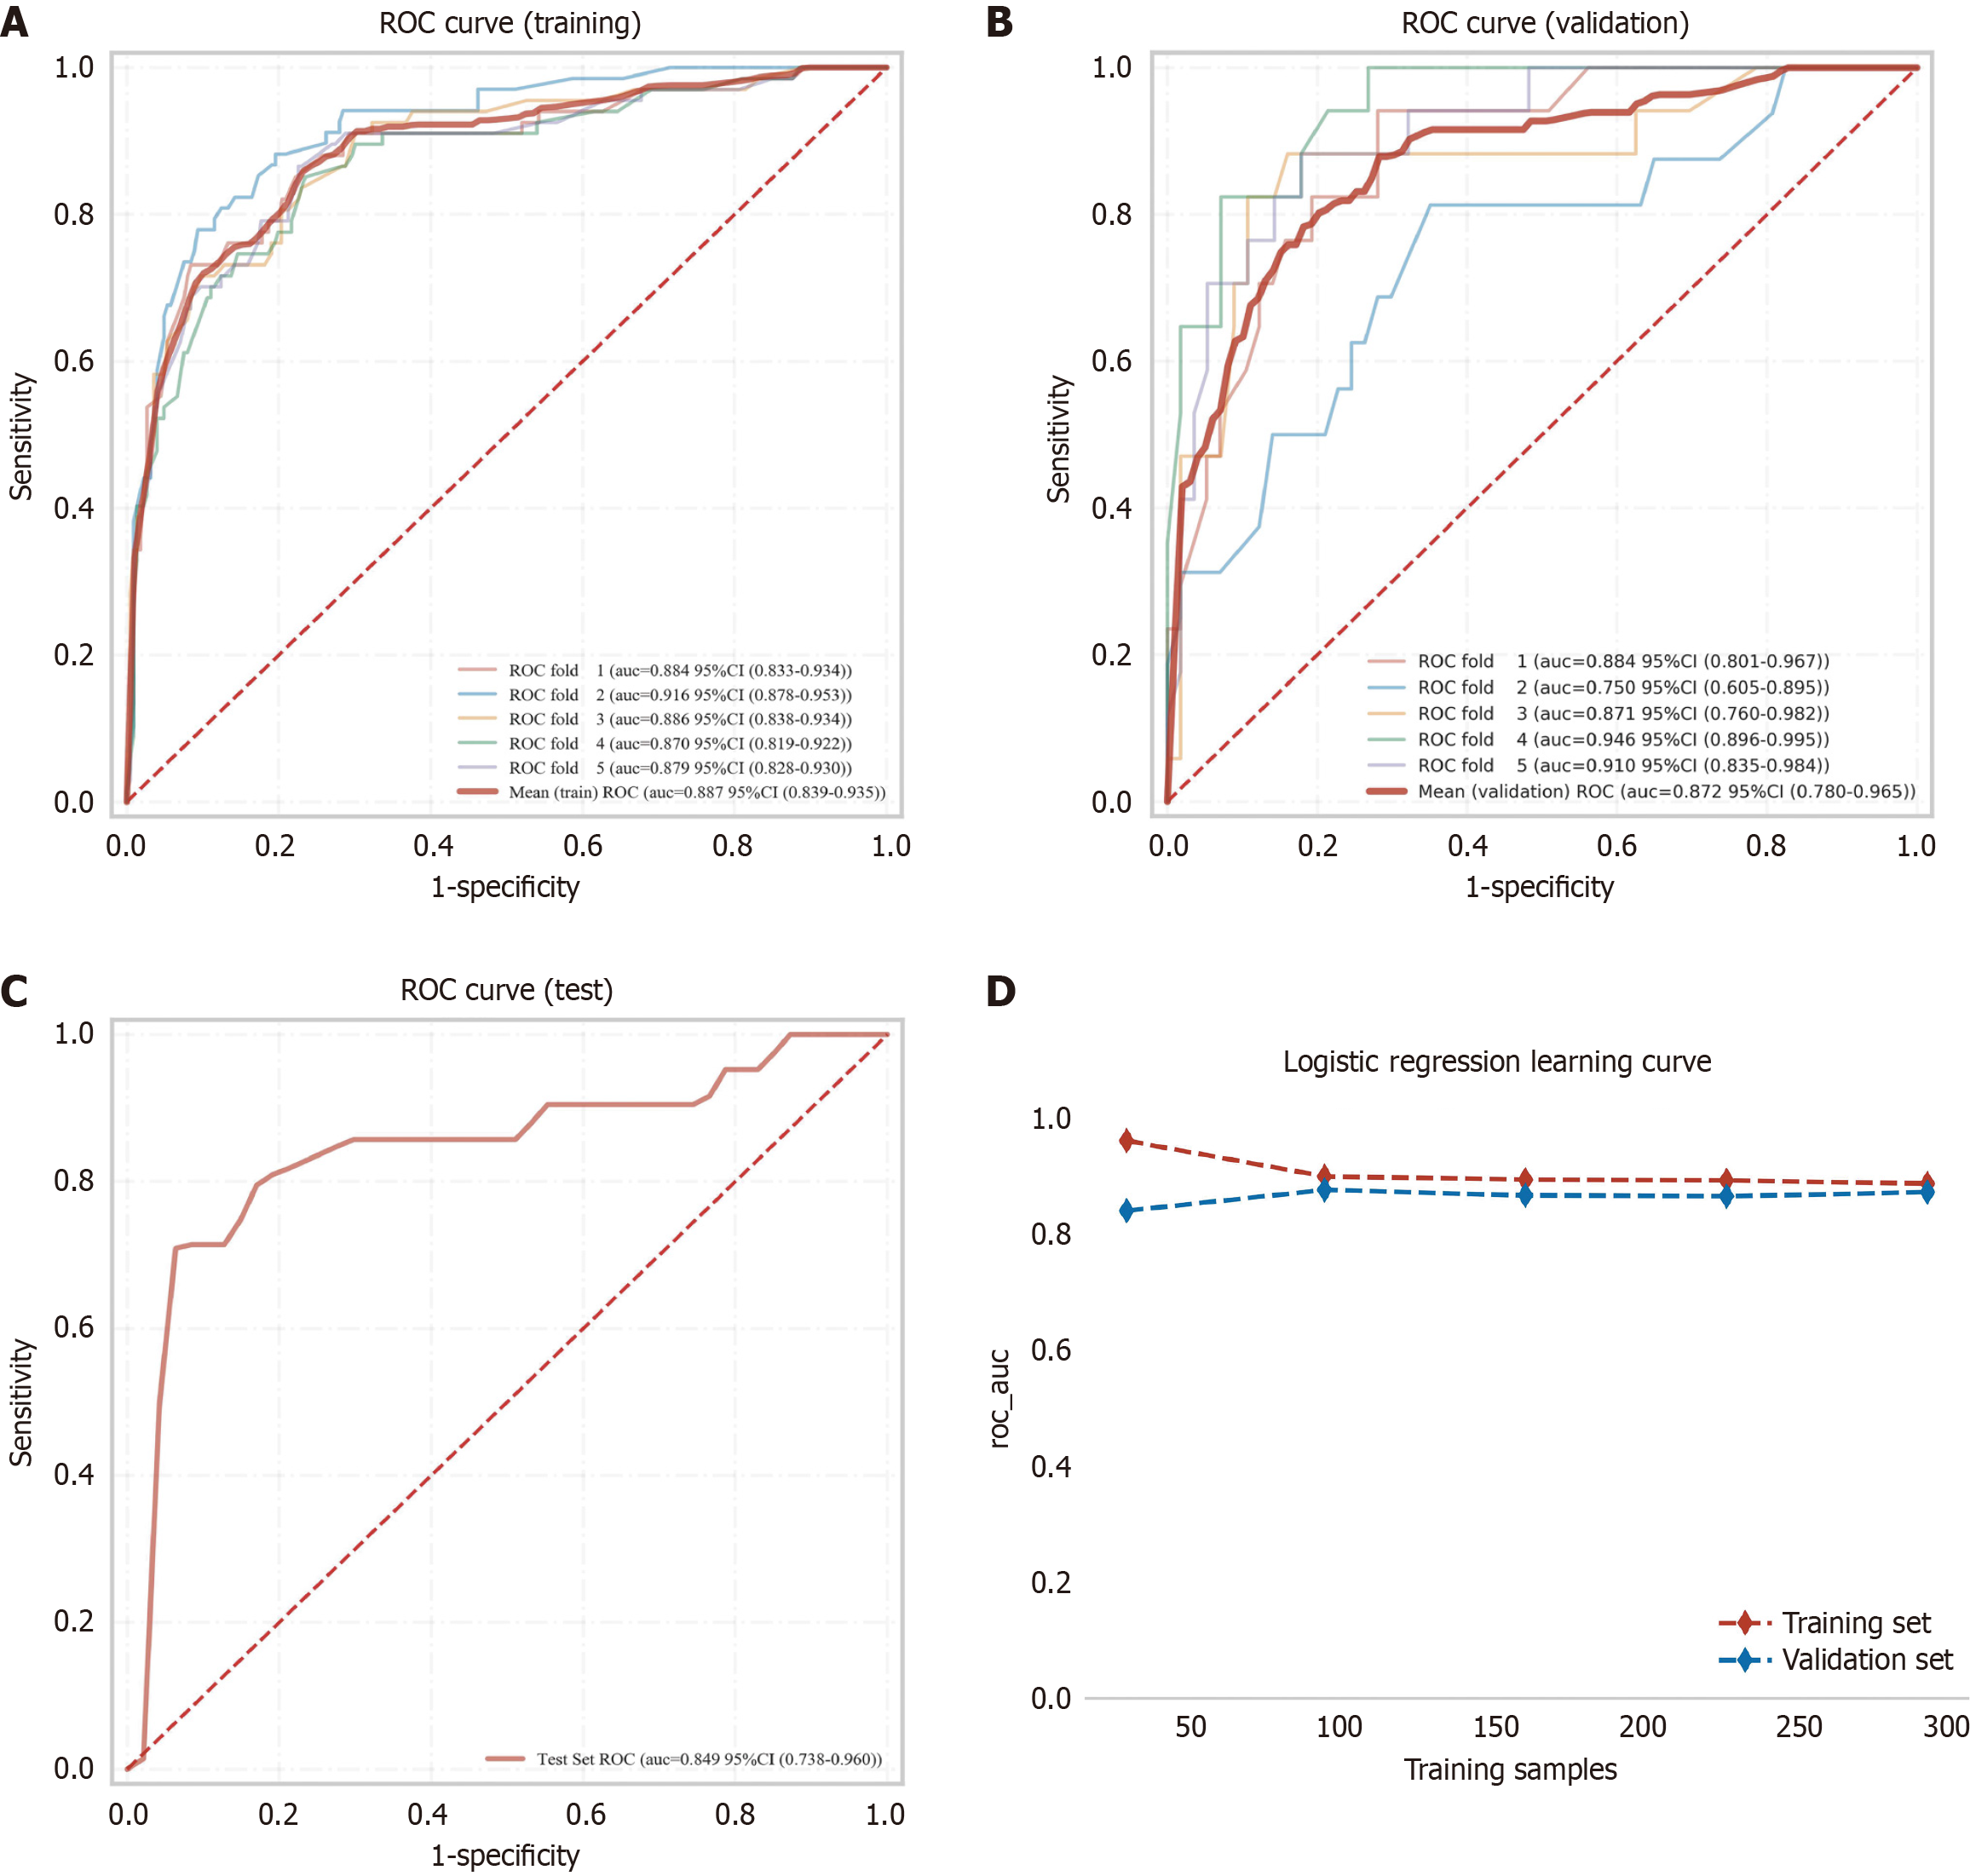
Figure 4 Performance evaluation of the logistic regression model across the training, validation, and external test sets.
A: Receiver operating characteristic (ROC) curve and area under the curve (AUC) value for the training set; B: ROC curve and AUC values for the validation set, constructed through random selection of 30% of training cases with 5-fold cross-validation. Five solid lines represent individual validation fold outcomes; C: ROC curve and AUC value for the independent external test set; D: Learning curves show performance progression, with training and validation sets represented by red and blue dashed lines, respectively. ROC: Receiver operating characteristic; CI: Confidence interval.
- Citation: Luo ZC, Guo HY, Tang X, Chen XR, Zhang CY, Cui YT, Zuo J, Li HR, Hou XM, Chen H, Song SB, Wang XF. Predicting the magnitude of risk for non-curative endoscopic submucosal dissection in superficial esophageal cancer using explainable artificial intelligence. World J Gastrointest Oncol 2026; 18(2): 114782
- URL: https://www.wjgnet.com/1948-5204/full/v18/i2/114782.htm
- DOI: https://dx.doi.org/10.4251/wjgo.v18.i2.114782