
















©The Author(s) 2026.
World J Gastrointest Oncol. Feb 15, 2026; 18(2): 114782
Published online Feb 15, 2026. doi: 10.4251/wjgo.v18.i2.114782
Published online Feb 15, 2026. doi: 10.4251/wjgo.v18.i2.114782
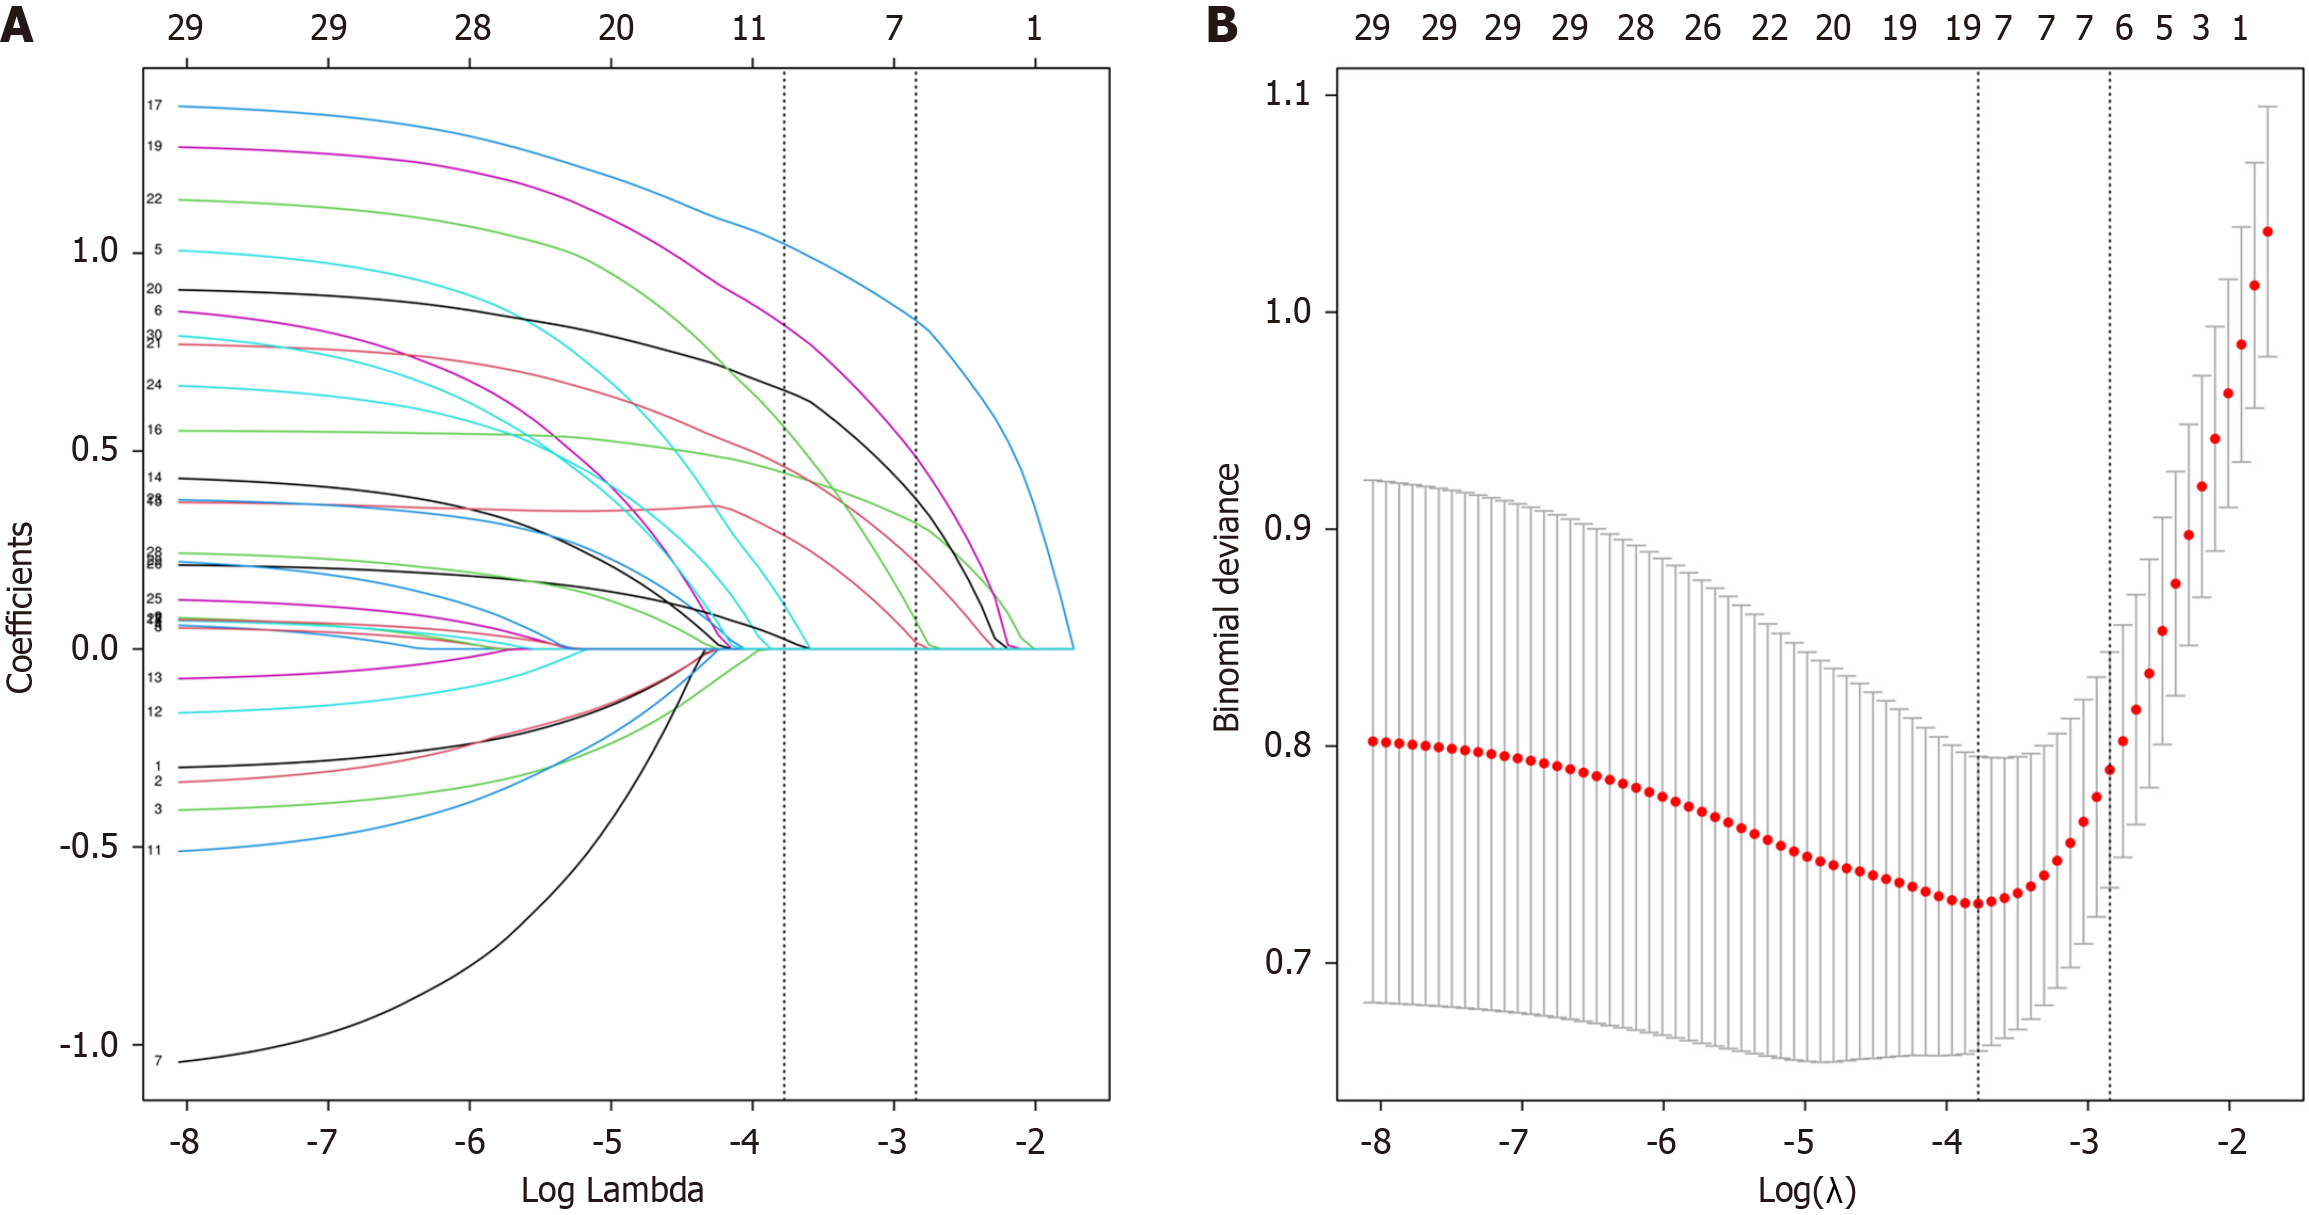
Figure 2 Least absolute shrinkage and selection operator regression analysis for feature selection.
A: Coefficient paths of 30 variables vs log(λ). Vertical lines indicate key λ values: 0.023 (9 variables, minimal mean squared error) and 0.058 (7 core variables under 1-SE rule); B: Cross-validation curve shows deviance vs log(λ) with error bands. λ = 0.023 gives minimum deviance; λ = 0.058 provides optimal parsimony. Together, these demonstrate regularization’s control of model complexity and prediction performance.
- Citation: Luo ZC, Guo HY, Tang X, Chen XR, Zhang CY, Cui YT, Zuo J, Li HR, Hou XM, Chen H, Song SB, Wang XF. Predicting the magnitude of risk for non-curative endoscopic submucosal dissection in superficial esophageal cancer using explainable artificial intelligence. World J Gastrointest Oncol 2026; 18(2): 114782
- URL: https://www.wjgnet.com/1948-5204/full/v18/i2/114782.htm
- DOI: https://dx.doi.org/10.4251/wjgo.v18.i2.114782