
















©The Author(s) 2026.
World J Gastrointest Oncol. Feb 15, 2026; 18(2): 113959
Published online Feb 15, 2026. doi: 10.4251/wjgo.v18.i2.113959
Published online Feb 15, 2026. doi: 10.4251/wjgo.v18.i2.113959
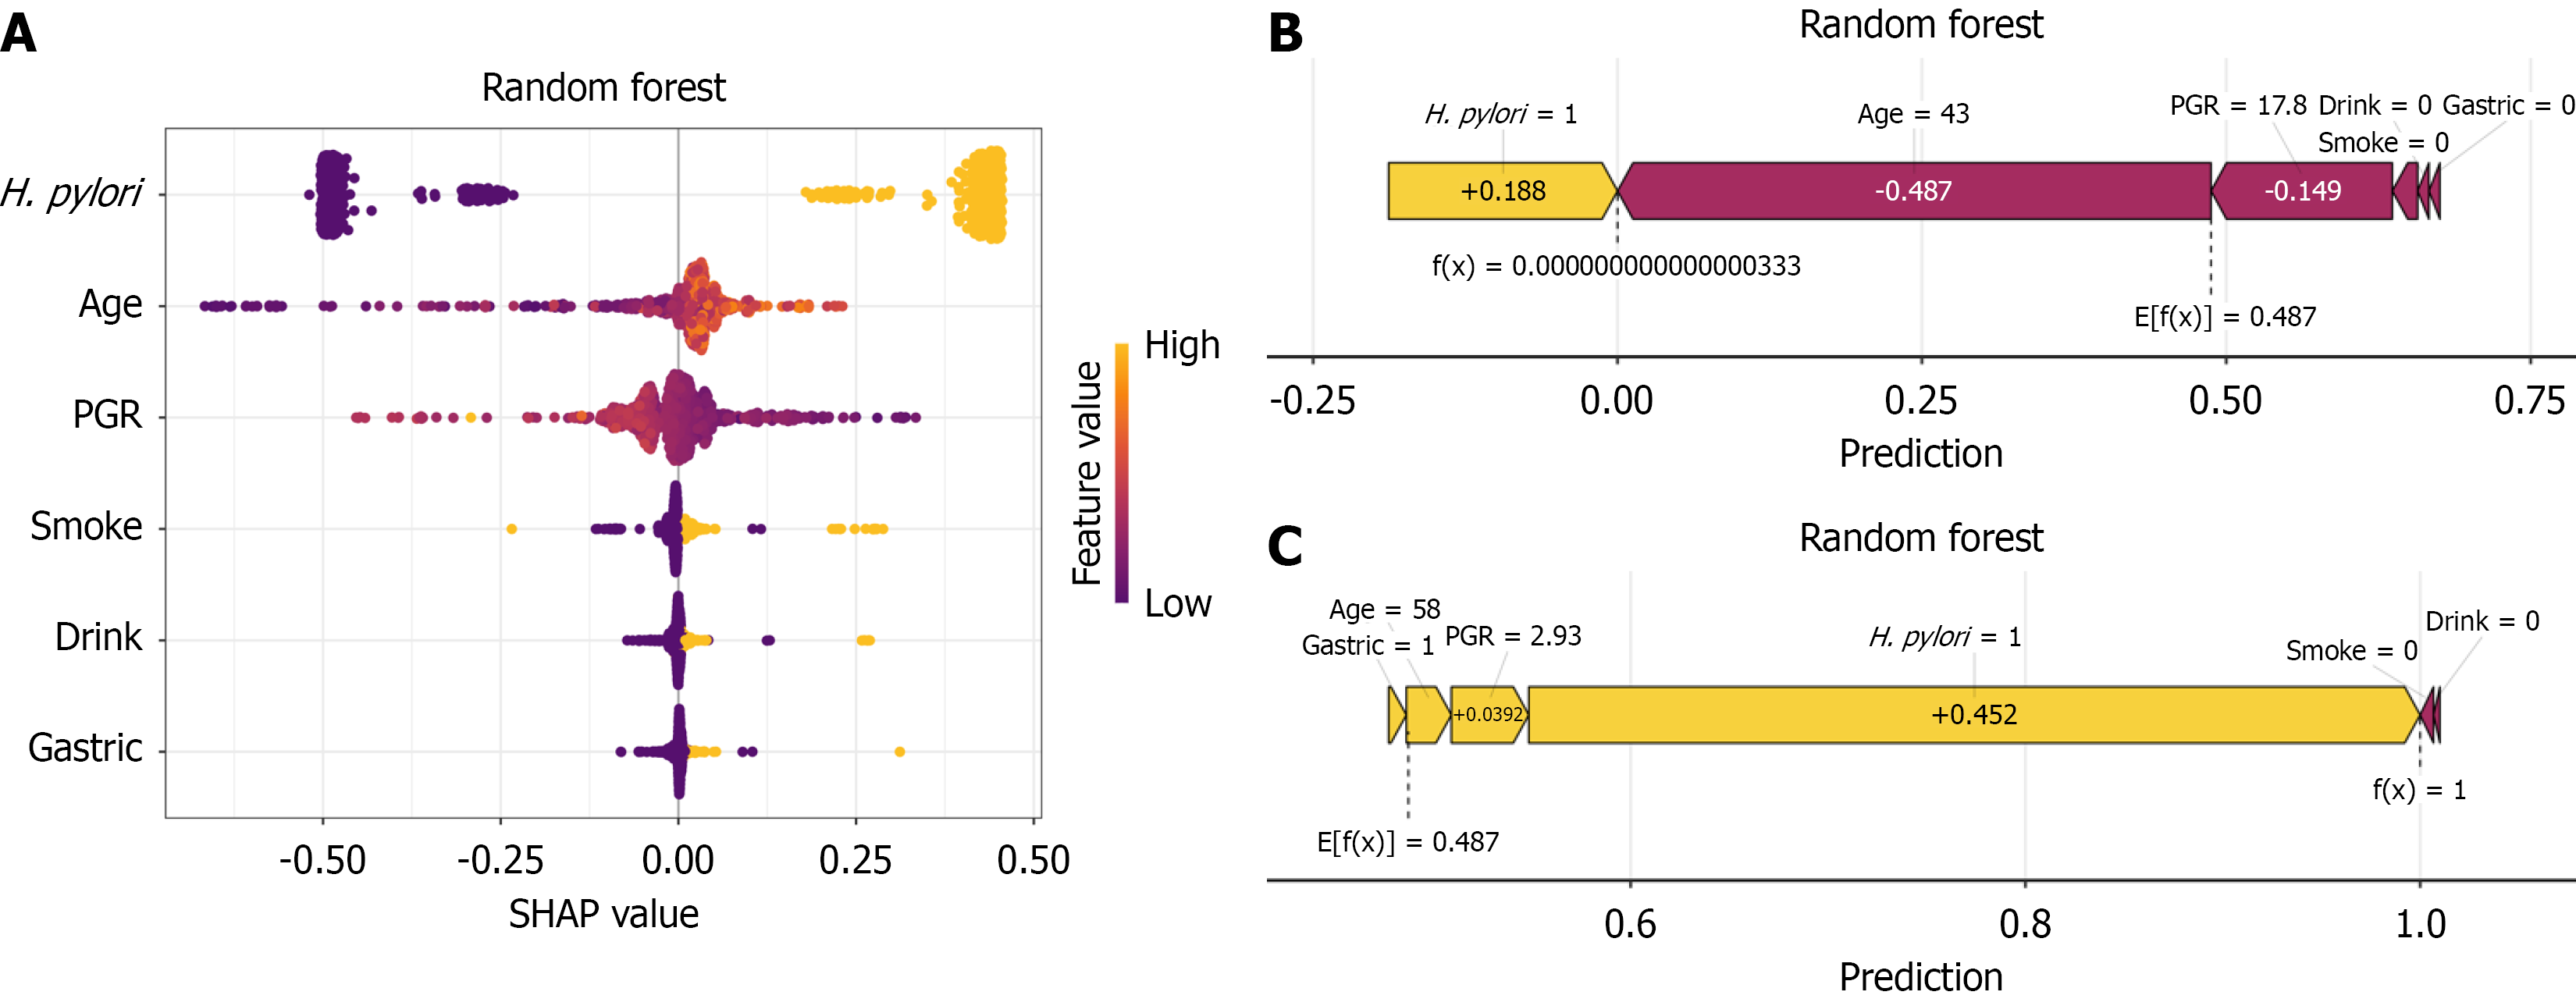
Figure 4 SHapley Additive exPlanation Model Interpretation.
A: Each point in the graph represents a feature, and the horizontal axis represents the SHapley Additive exPlanation value. The feature importance is ranked from top to bottom. Yellow points indicate higher feature values, and blue points indicate lower feature values; B and C: Interpretability analysis of two independent samples. Yellow represents a positive contribution to the model, and red represents a negative contribution. H. pylori: Helicobacter pylori; PGR: Pepsinogen I/II ratio; SHAP: SHapley Additive explanation.
- Citation: Cao H, Han JL, Wu H, Si SP, Ding LJ, Ji L, Zhang HZ, Yin J, Zhou ZY, Zhang YN, Lv ZF, Tian WY, Zhan Q, Wang H, An FM. Risk prediction for chronic atrophic gastritis using a random forest model: A multicenter study. World J Gastrointest Oncol 2026; 18(2): 113959
- URL: https://www.wjgnet.com/1948-5204/full/v18/i2/113959.htm
- DOI: https://dx.doi.org/10.4251/wjgo.v18.i2.113959