
















©The Author(s) 2026.
World J Gastrointest Oncol. Feb 15, 2026; 18(2): 113959
Published online Feb 15, 2026. doi: 10.4251/wjgo.v18.i2.113959
Published online Feb 15, 2026. doi: 10.4251/wjgo.v18.i2.113959
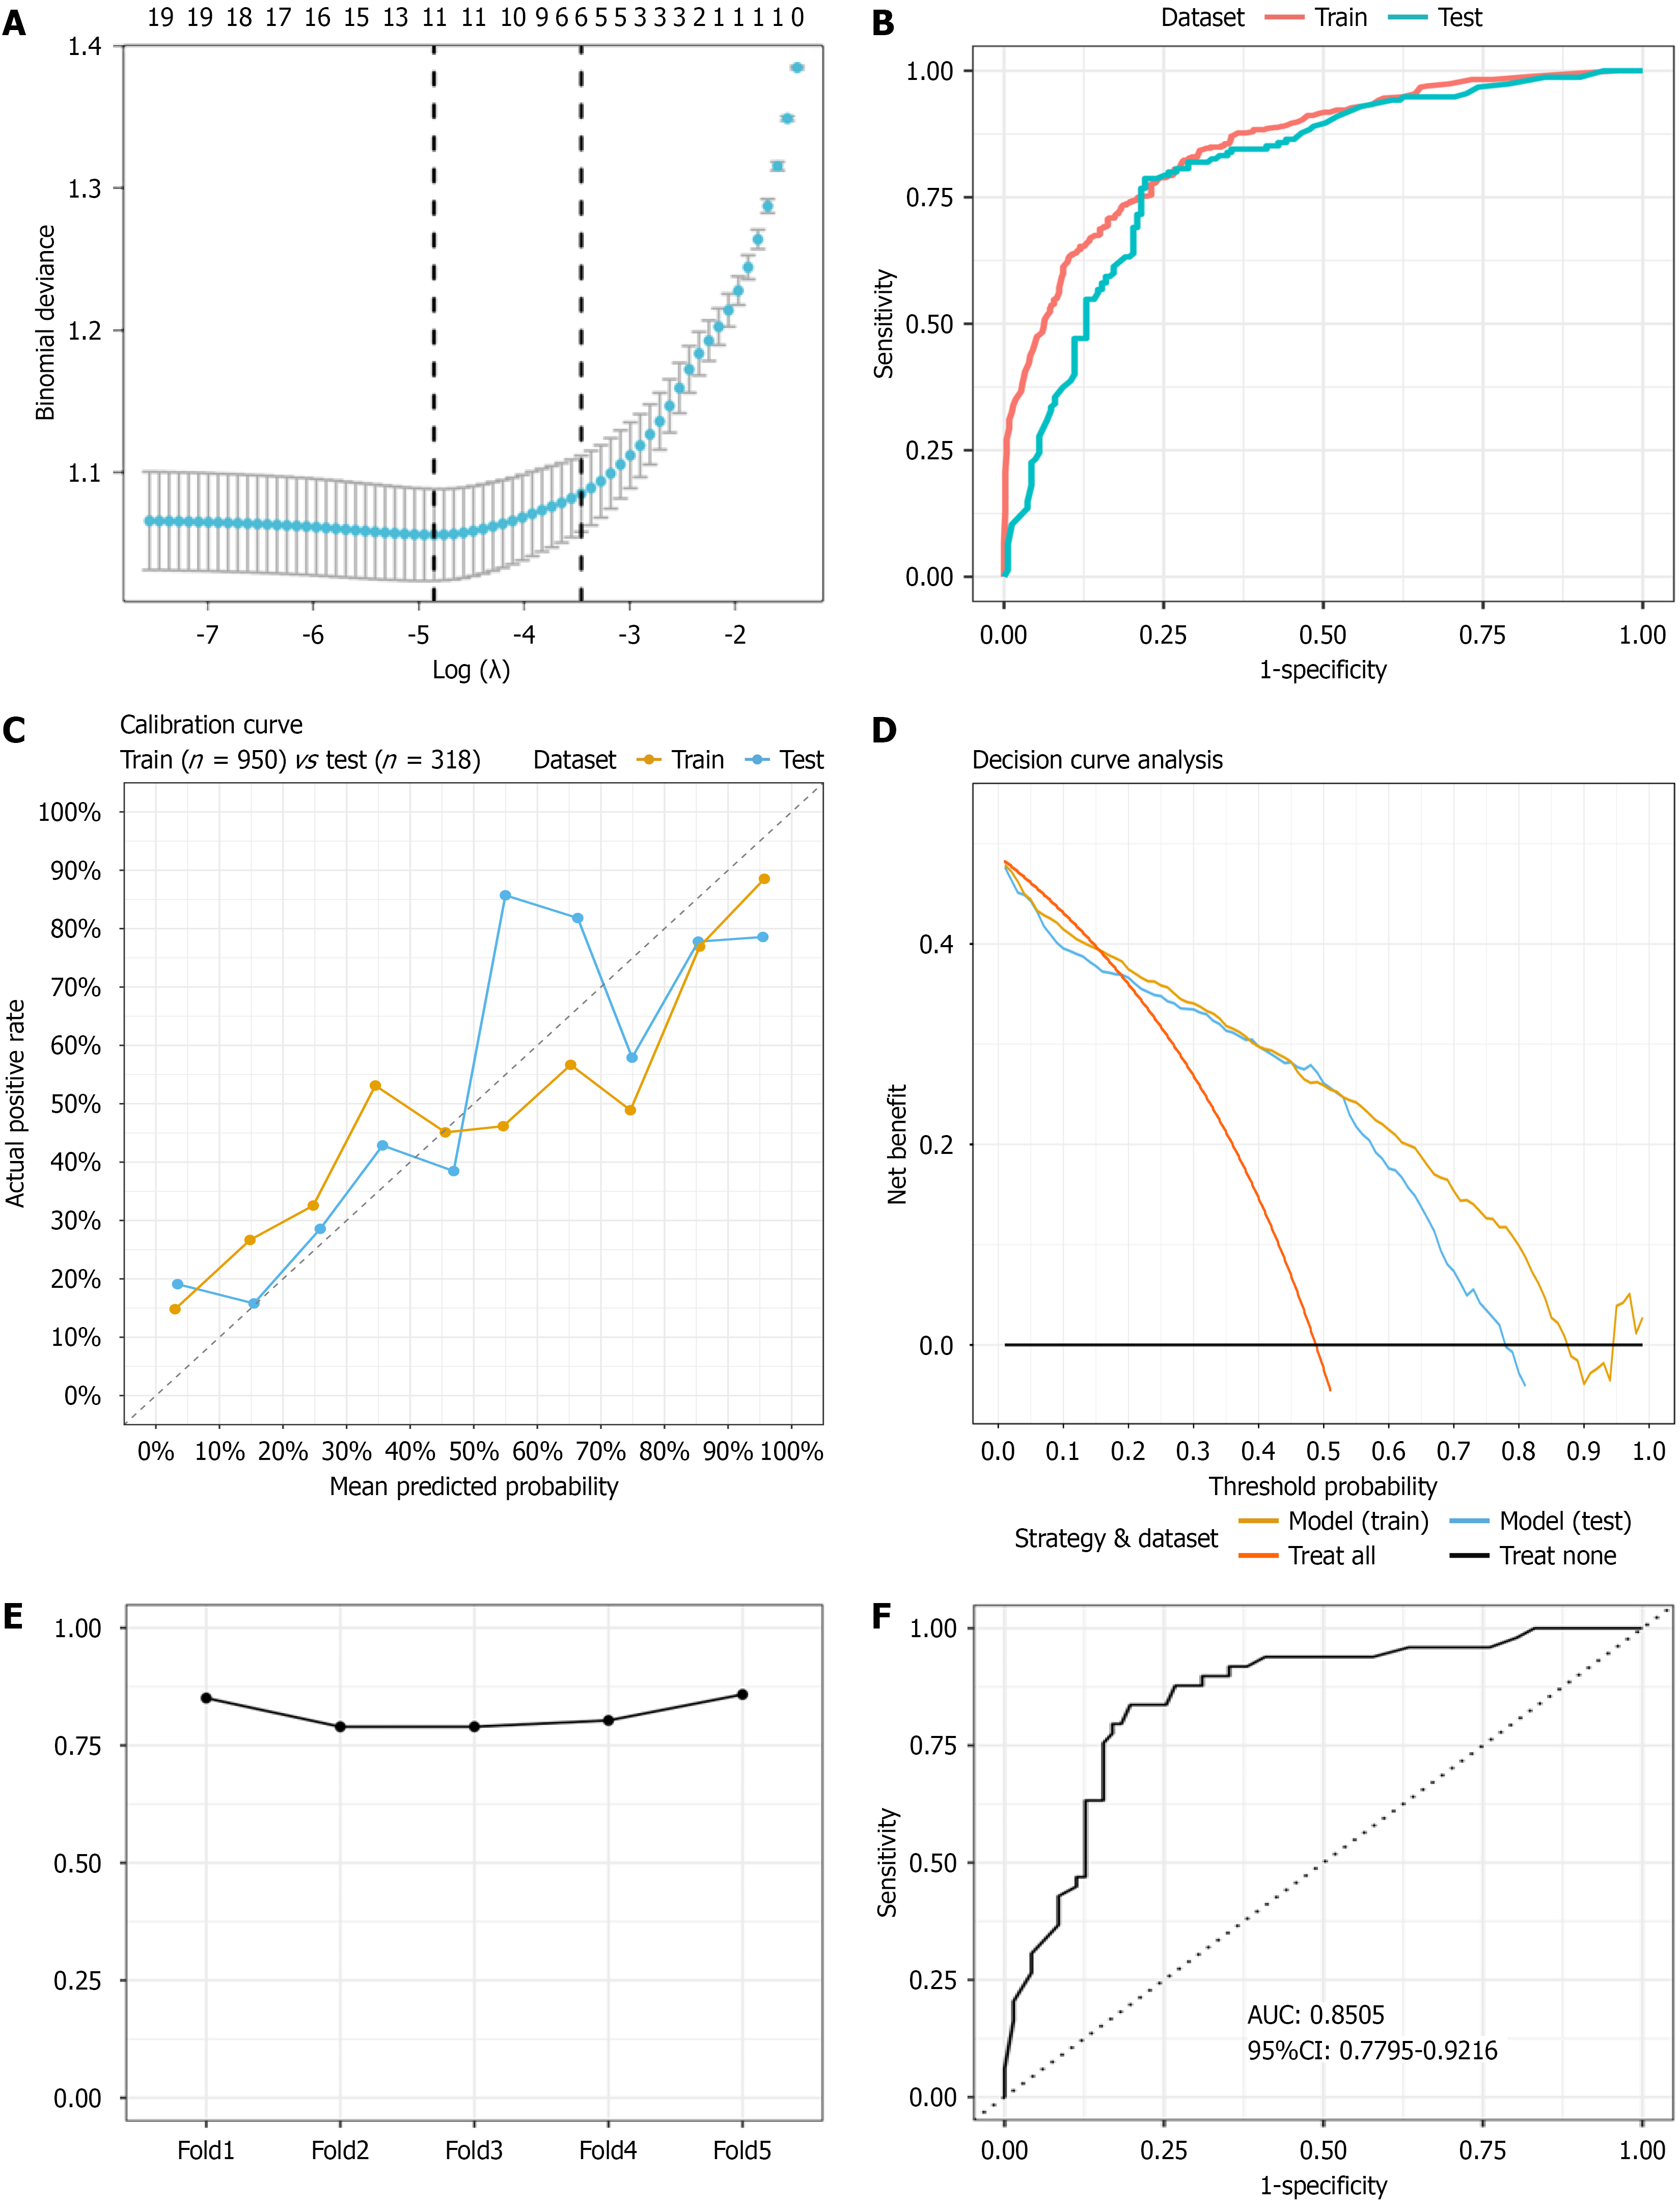
Figure 2 Development and validation of the prediction model for chronic atrophic gastritis.
A: Feature selection was performed using least absolute shrinkage and selection operator regression. The dashed line on the left (λ.min) represents the optimal solution with the minimum lambda value, whereas the line on the right (λ.1se) corresponds to the simplest model within one standard error of λ.min; B: Receiver operating characteristic (ROC) curves for the training and testing sets; C: Calibration curves for both the training and testing sets; D: Decision curve analysis for the model; E: Results of the 5-fold cross-validation, showing the area under the curve (AUC) for each fold; F: ROC curve for the external validation set, with an AUC of 0.8505. AUC: Area under the curve.
- Citation: Cao H, Han JL, Wu H, Si SP, Ding LJ, Ji L, Zhang HZ, Yin J, Zhou ZY, Zhang YN, Lv ZF, Tian WY, Zhan Q, Wang H, An FM. Risk prediction for chronic atrophic gastritis using a random forest model: A multicenter study. World J Gastrointest Oncol 2026; 18(2): 113959
- URL: https://www.wjgnet.com/1948-5204/full/v18/i2/113959.htm
- DOI: https://dx.doi.org/10.4251/wjgo.v18.i2.113959