
















Copyright: ©Author(s) 2026.
World J Gastrointest Oncol. Nov 15, 2026; 18(11): 124061
Published online Nov 15, 2026. doi: 10.4251/wjgo.124061
Published online Nov 15, 2026. doi: 10.4251/wjgo.124061
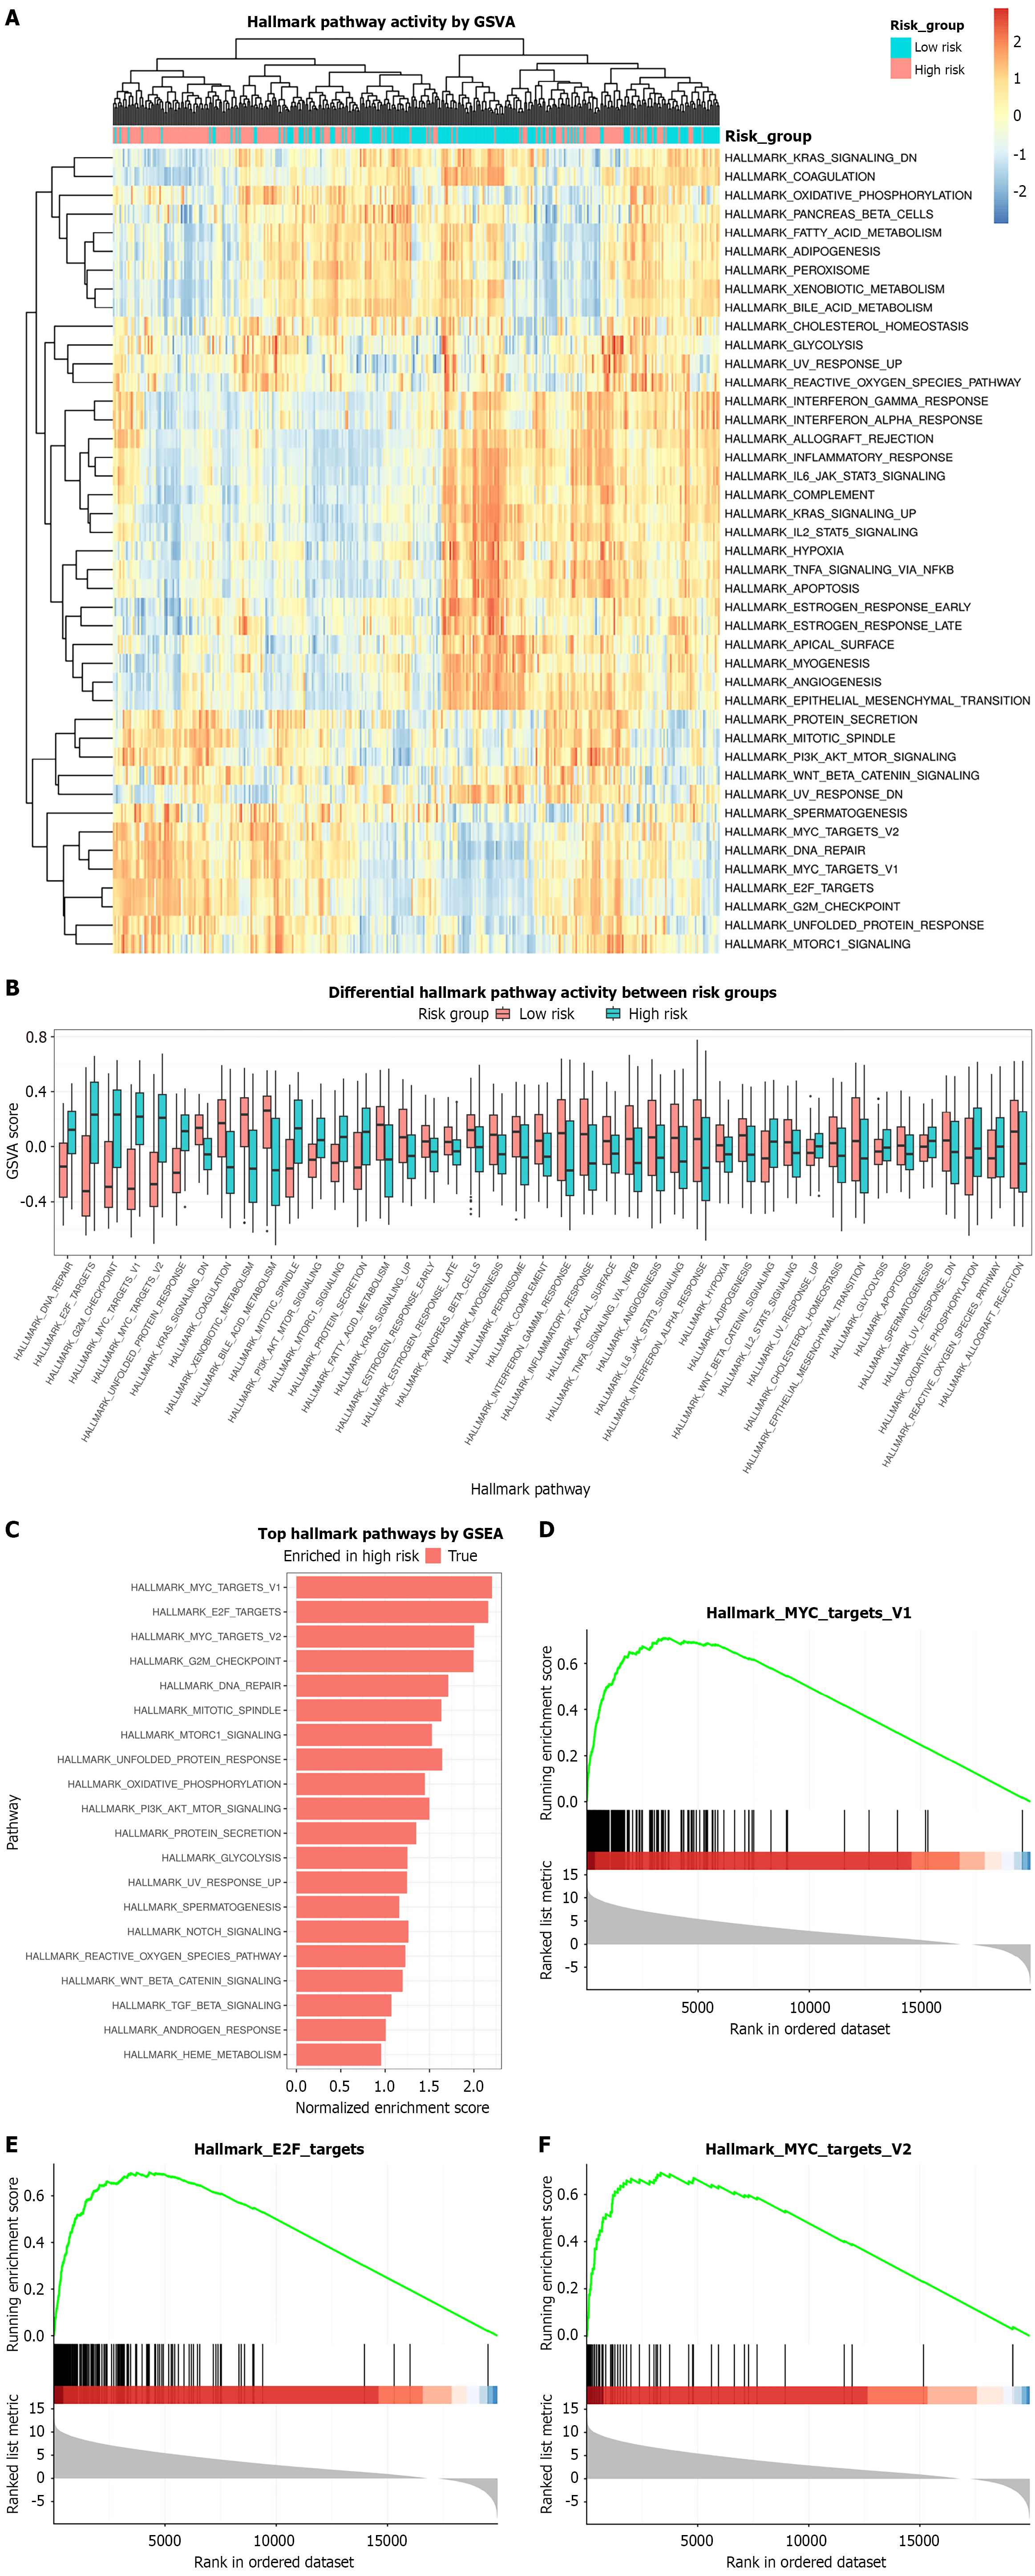
Figure 7 Hallmark pathway enrichment analysis of the ferroptosis-mitochondria-related risk signature.
A: Gene set variation analysis heatmap of differentially enriched Hallmark pathways; B: Boxplots of representative Hallmark pathways; C: Bar plot of normalized enrichment scores from gene set enrichment analysis; D-F: Gene set enrichment analysis plots for MYC targets V1, E2F targets, and MYC targets V2. GSEA: Gene set enrichment analysis; GSVA: Gene set variation analysis.
- Citation: Han S, Feng ZW, Ran Y, Ma GP, Zhou YC, Lv JZ, Li XB, Wang CH, Wang LZ, Hu SP. Ferroptosis-mitochondria-related molecular subtypes and prognostic signature reveal immune and pathway heterogeneity in hepatocellular carcinoma. World J Gastrointest Oncol 2026; 18(11): 124061
- URL: https://www.wjgnet.com/1948-5204/full/v18/i11/124061.htm
- DOI: https://dx.doi.org/10.4251/wjgo.124061