
















Copyright: ©Author(s) 2026.
World J Gastrointest Oncol. Nov 15, 2026; 18(11): 124061
Published online Nov 15, 2026. doi: 10.4251/wjgo.124061
Published online Nov 15, 2026. doi: 10.4251/wjgo.124061
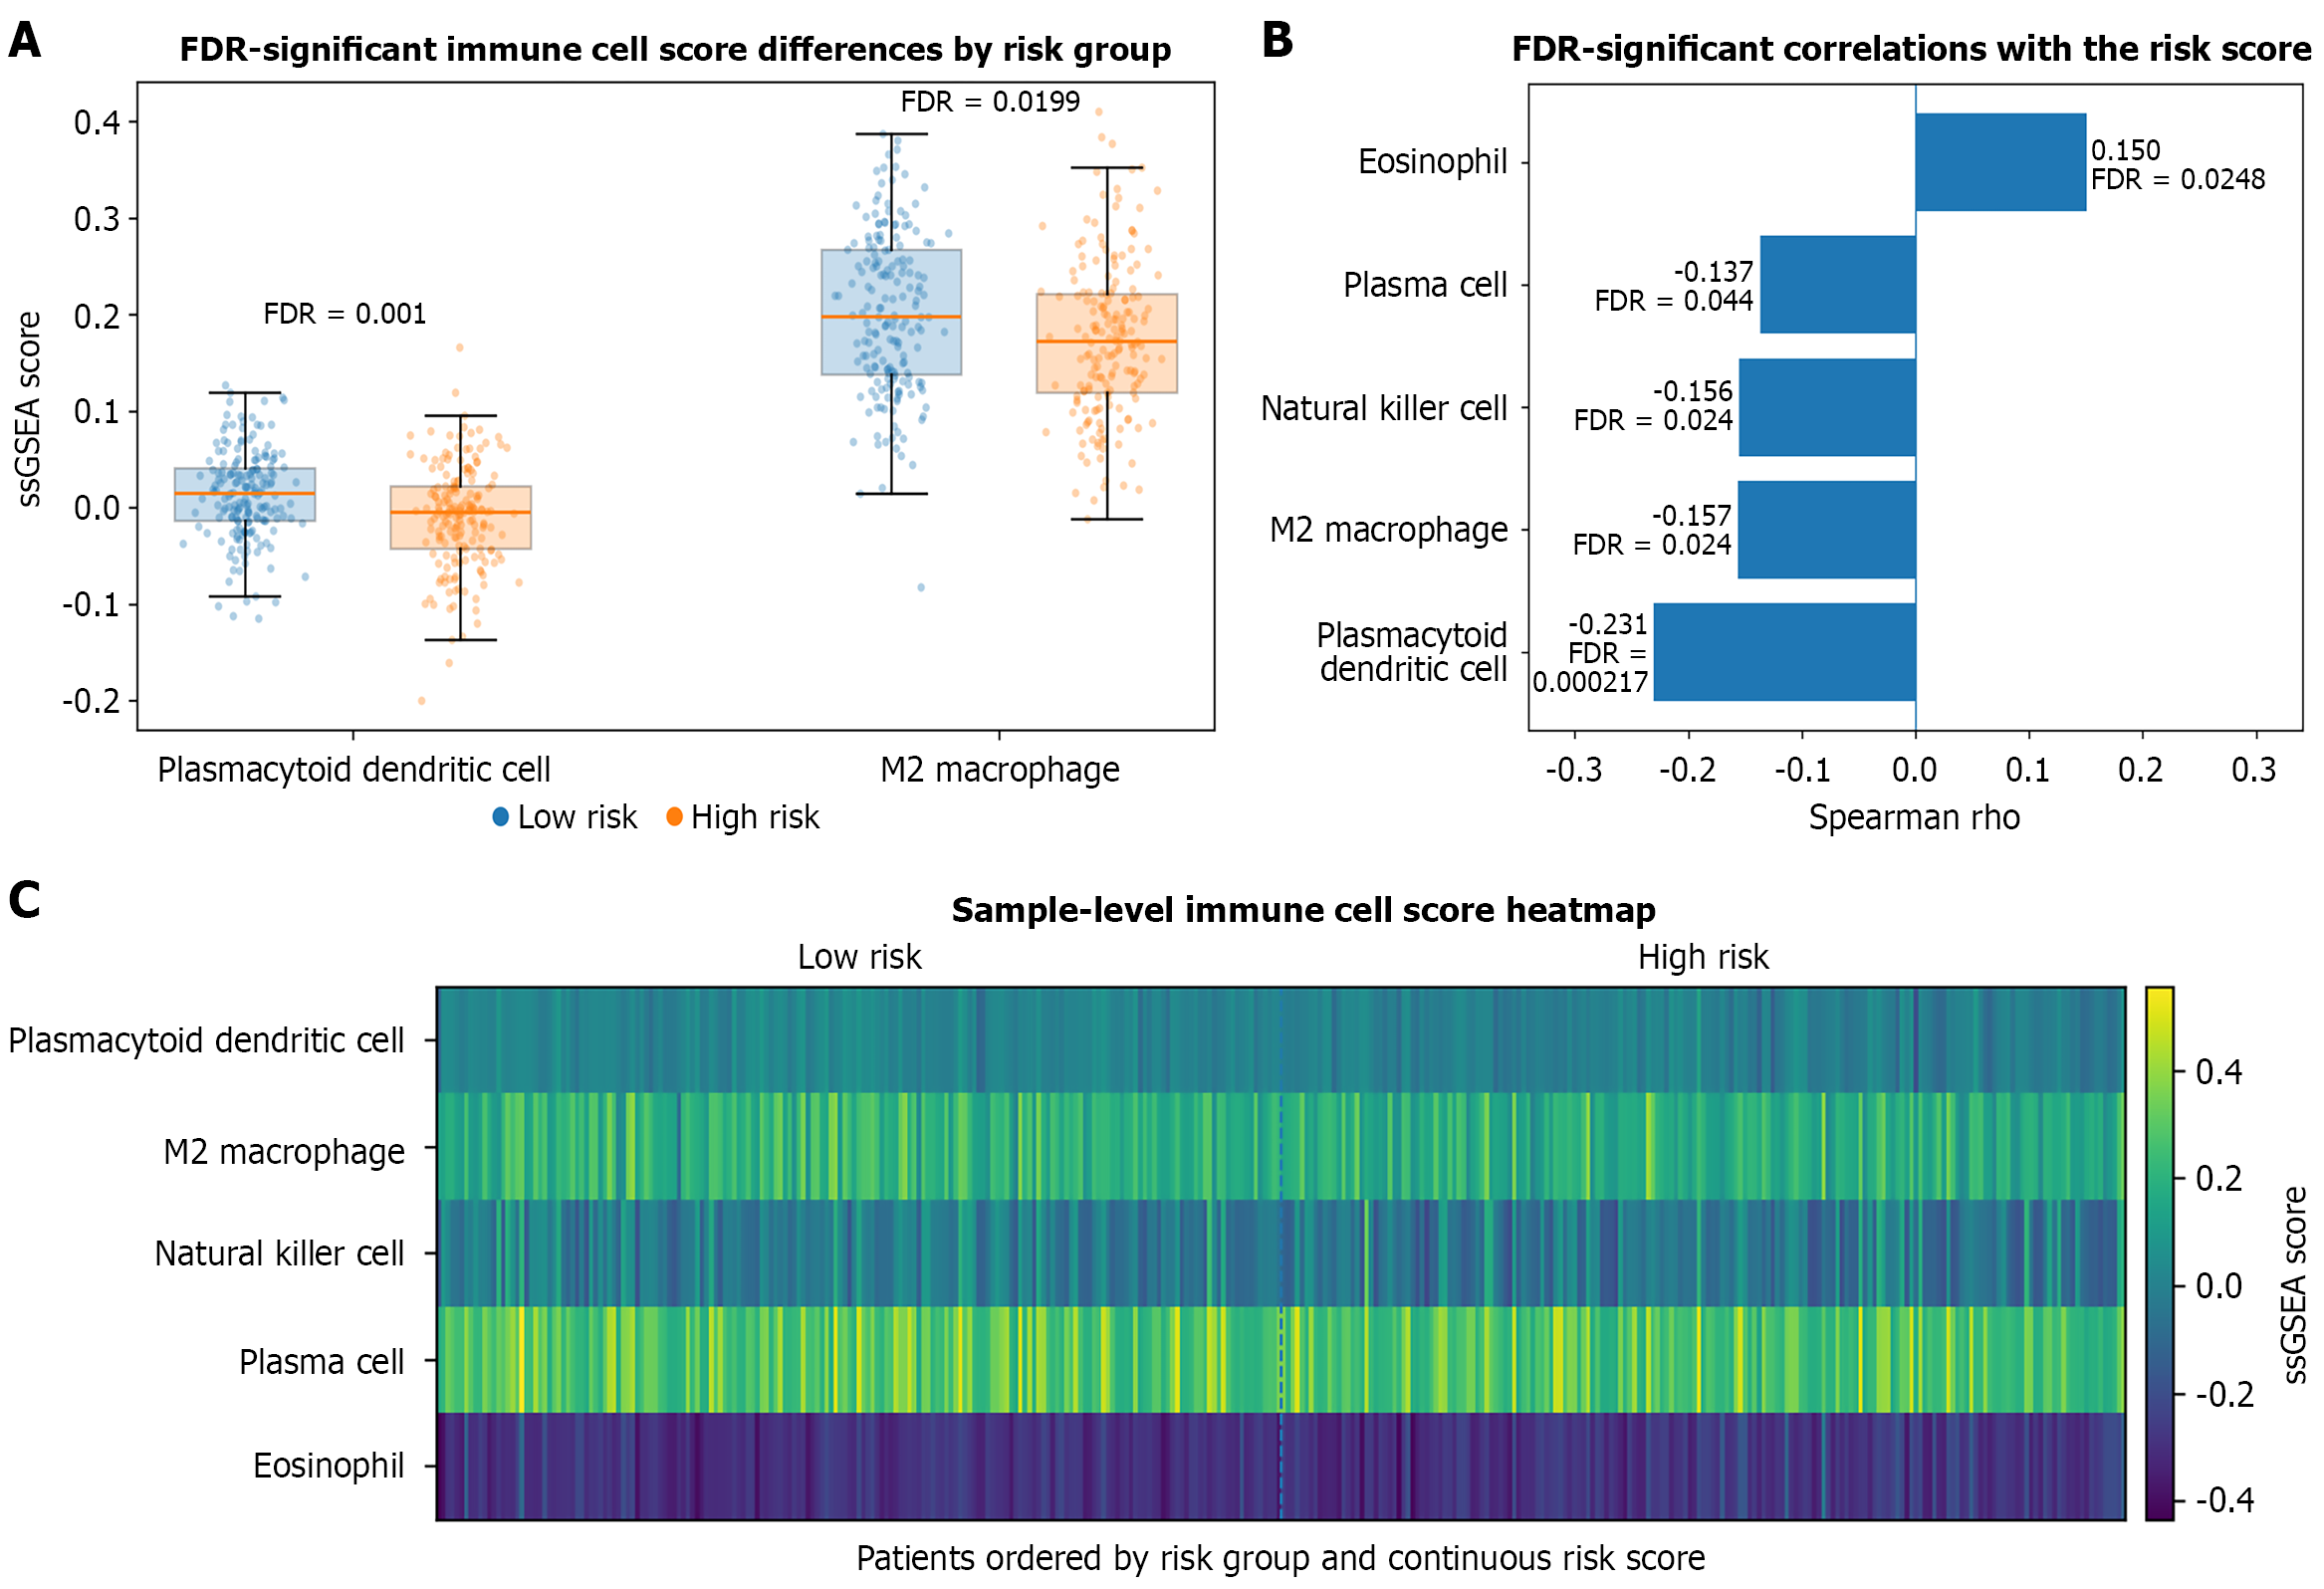
Figure 6 Single-sample gene set enrichment analysis-derived immune cell score patterns associated with the risk score.
A: Boxplots with individual patient observations for the two immune cell scores that differed significantly between the high- and low-risk groups after Benjamini-Hochberg correction; B: Spearman correlations between the continuous risk score and immune cell scores that remained significant after false discovery rate correction; C: Sample-level heatmap of the five immune cell scores that remained significant after false discovery rate correction, ordered by risk group and continuous risk score. FDR: False discovery rate; ssGSEA: Single-sample gene set enrichment analysis.
- Citation: Han S, Feng ZW, Ran Y, Ma GP, Zhou YC, Lv JZ, Li XB, Wang CH, Wang LZ, Hu SP. Ferroptosis-mitochondria-related molecular subtypes and prognostic signature reveal immune and pathway heterogeneity in hepatocellular carcinoma. World J Gastrointest Oncol 2026; 18(11): 124061
- URL: https://www.wjgnet.com/1948-5204/full/v18/i11/124061.htm
- DOI: https://dx.doi.org/10.4251/wjgo.124061