
















Copyright: ©Author(s) 2026.
World J Gastrointest Oncol. Nov 15, 2026; 18(11): 124061
Published online Nov 15, 2026. doi: 10.4251/wjgo.124061
Published online Nov 15, 2026. doi: 10.4251/wjgo.124061
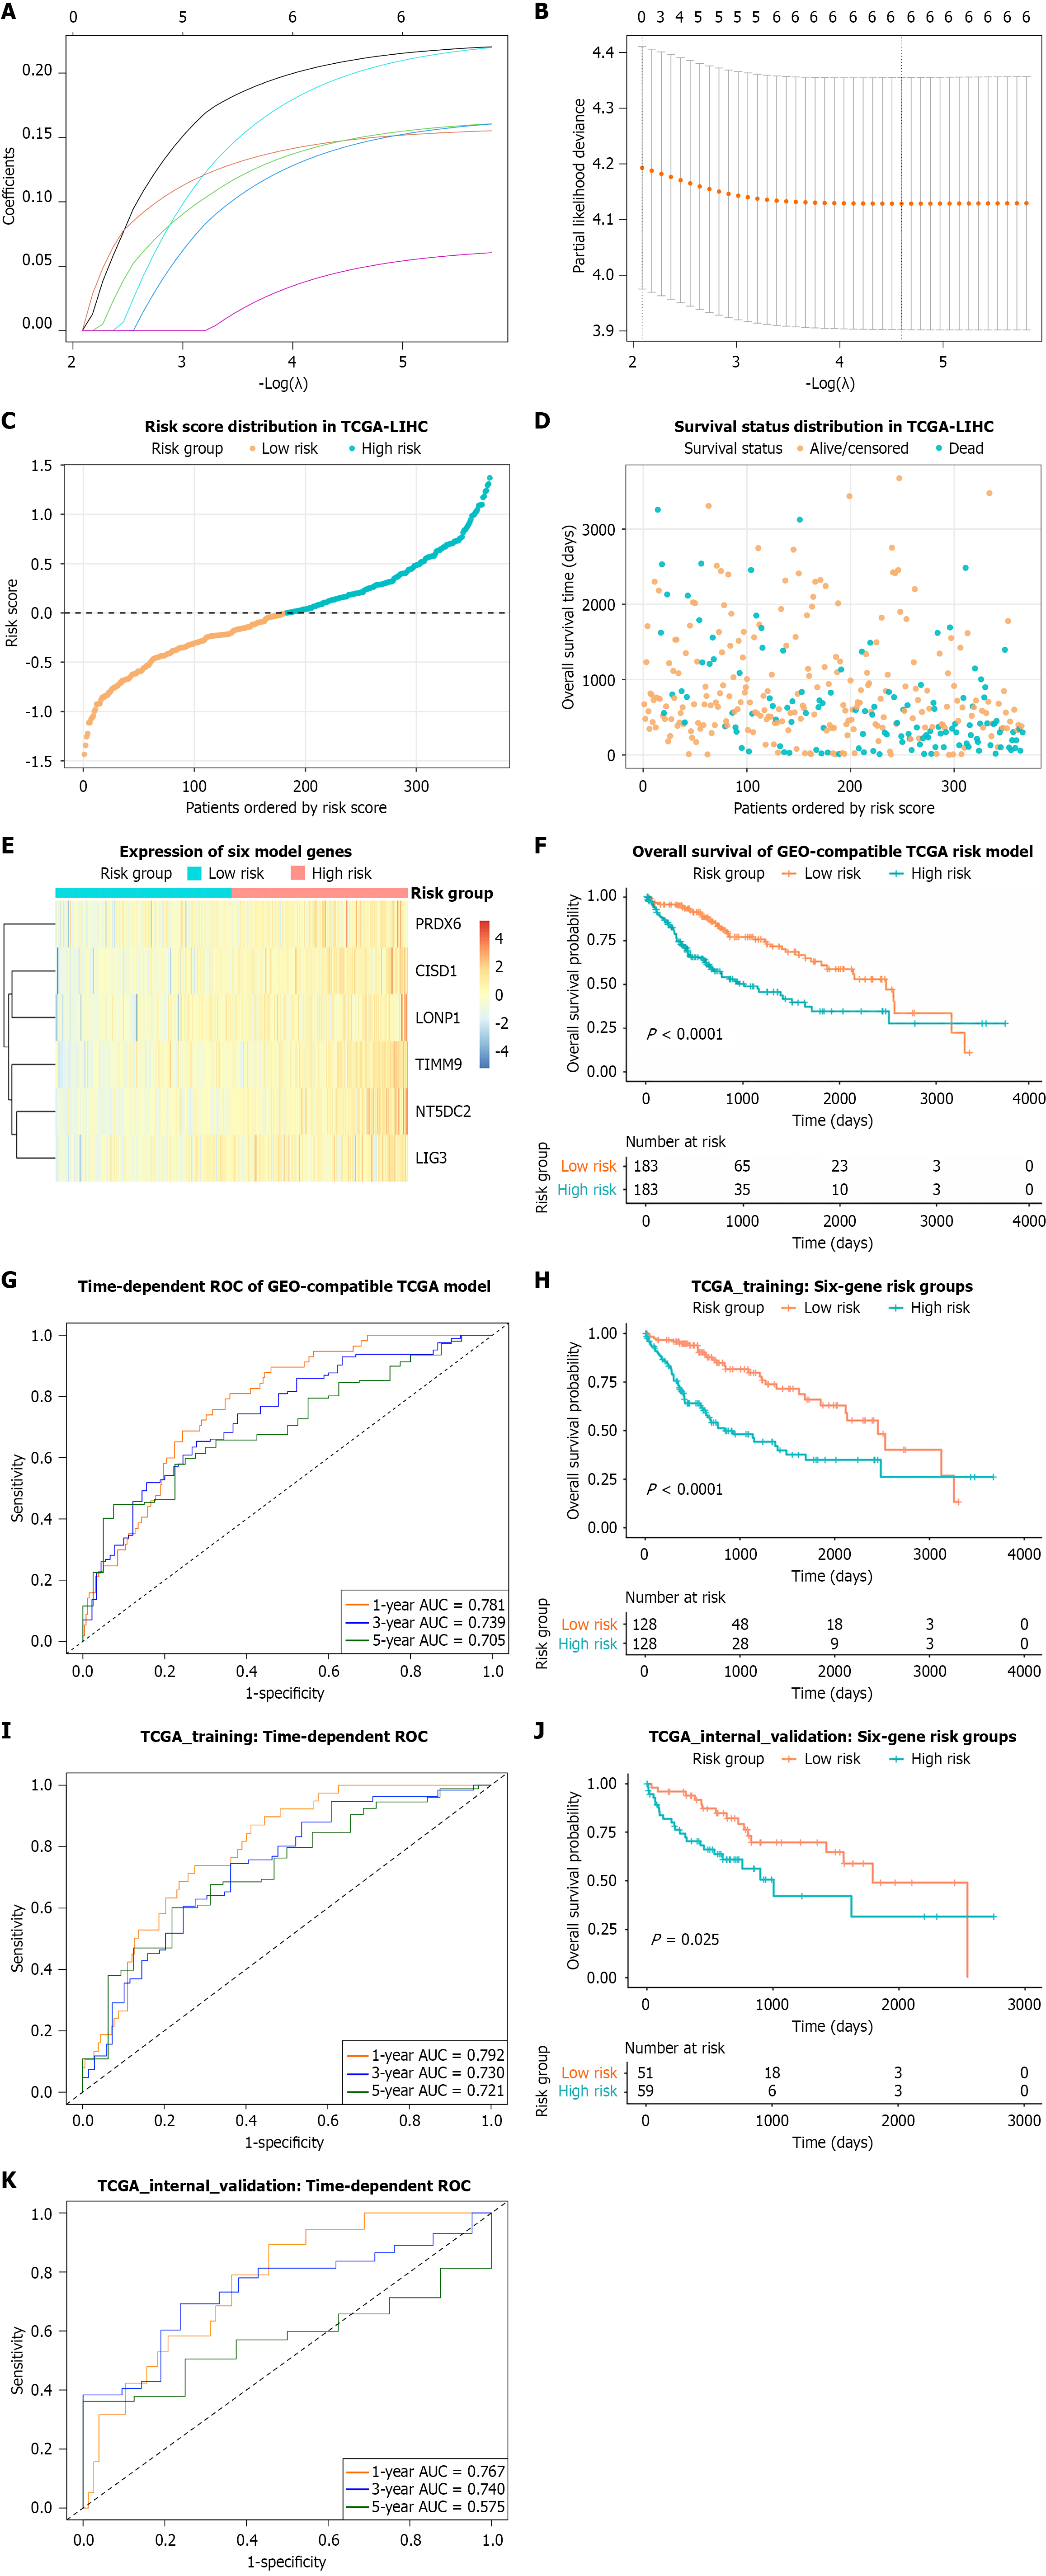
Figure 4 Construction and internal validation of the six-gene ferroptosis-mitochondria-related prognostic signature.
A: Least absolute shrinkage and selection operator coefficient profiles; B: Tenfold cross-validation curve for selection of the optimal penalty parameter; C: Risk score distribution in the full The Cancer Genome Atlas liver hepatocellular carcinoma (TCGA-LIHC) cohort; D: Survival status distribution in the full cohort; E: Heatmap of the six model genes ordered by risk score; F: Kaplan-Meier overall survival curves for the full TCGA-LIHC high- and low-risk groups; G: Time-dependent receiver operating characteristic curves for 1-, 3-, and 5-year overall survival in the full TCGA-LIHC cohort; H: Kaplan-Meier curves for the training cohort (n = 256; log-rank P = 3.66 × 10⁻⁶); I: Time-dependent receiver operating characteristic curves in the training cohort, with 1-, 3-, and 5-year areas under the curve of 0.792, 0.730, and 0.721, respectively; J: Kaplan-Meier curves for the internal validation cohort (n = 110; log-rank P = 0.0245); K: Time-dependent receiver operating characteristic curves in the internal validation cohort, with 1-, 3-, and 5-year areas under the curve of 0.767, 0.740, and 0.575, respectively. TCGA-LIHC: The Cancer Genome Atlas liver hepatocellular carcinoma; AUC: Area under the curve; ROC: Receiver operating characteristic.
- Citation: Han S, Feng ZW, Ran Y, Ma GP, Zhou YC, Lv JZ, Li XB, Wang CH, Wang LZ, Hu SP. Ferroptosis-mitochondria-related molecular subtypes and prognostic signature reveal immune and pathway heterogeneity in hepatocellular carcinoma. World J Gastrointest Oncol 2026; 18(11): 124061
- URL: https://www.wjgnet.com/1948-5204/full/v18/i11/124061.htm
- DOI: https://dx.doi.org/10.4251/wjgo.124061