
















Copyright: ©Author(s) 2026.
World J Gastrointest Oncol. Nov 15, 2026; 18(11): 123631
Published online Nov 15, 2026. doi: 10.4251/wjgo.123631
Published online Nov 15, 2026. doi: 10.4251/wjgo.123631
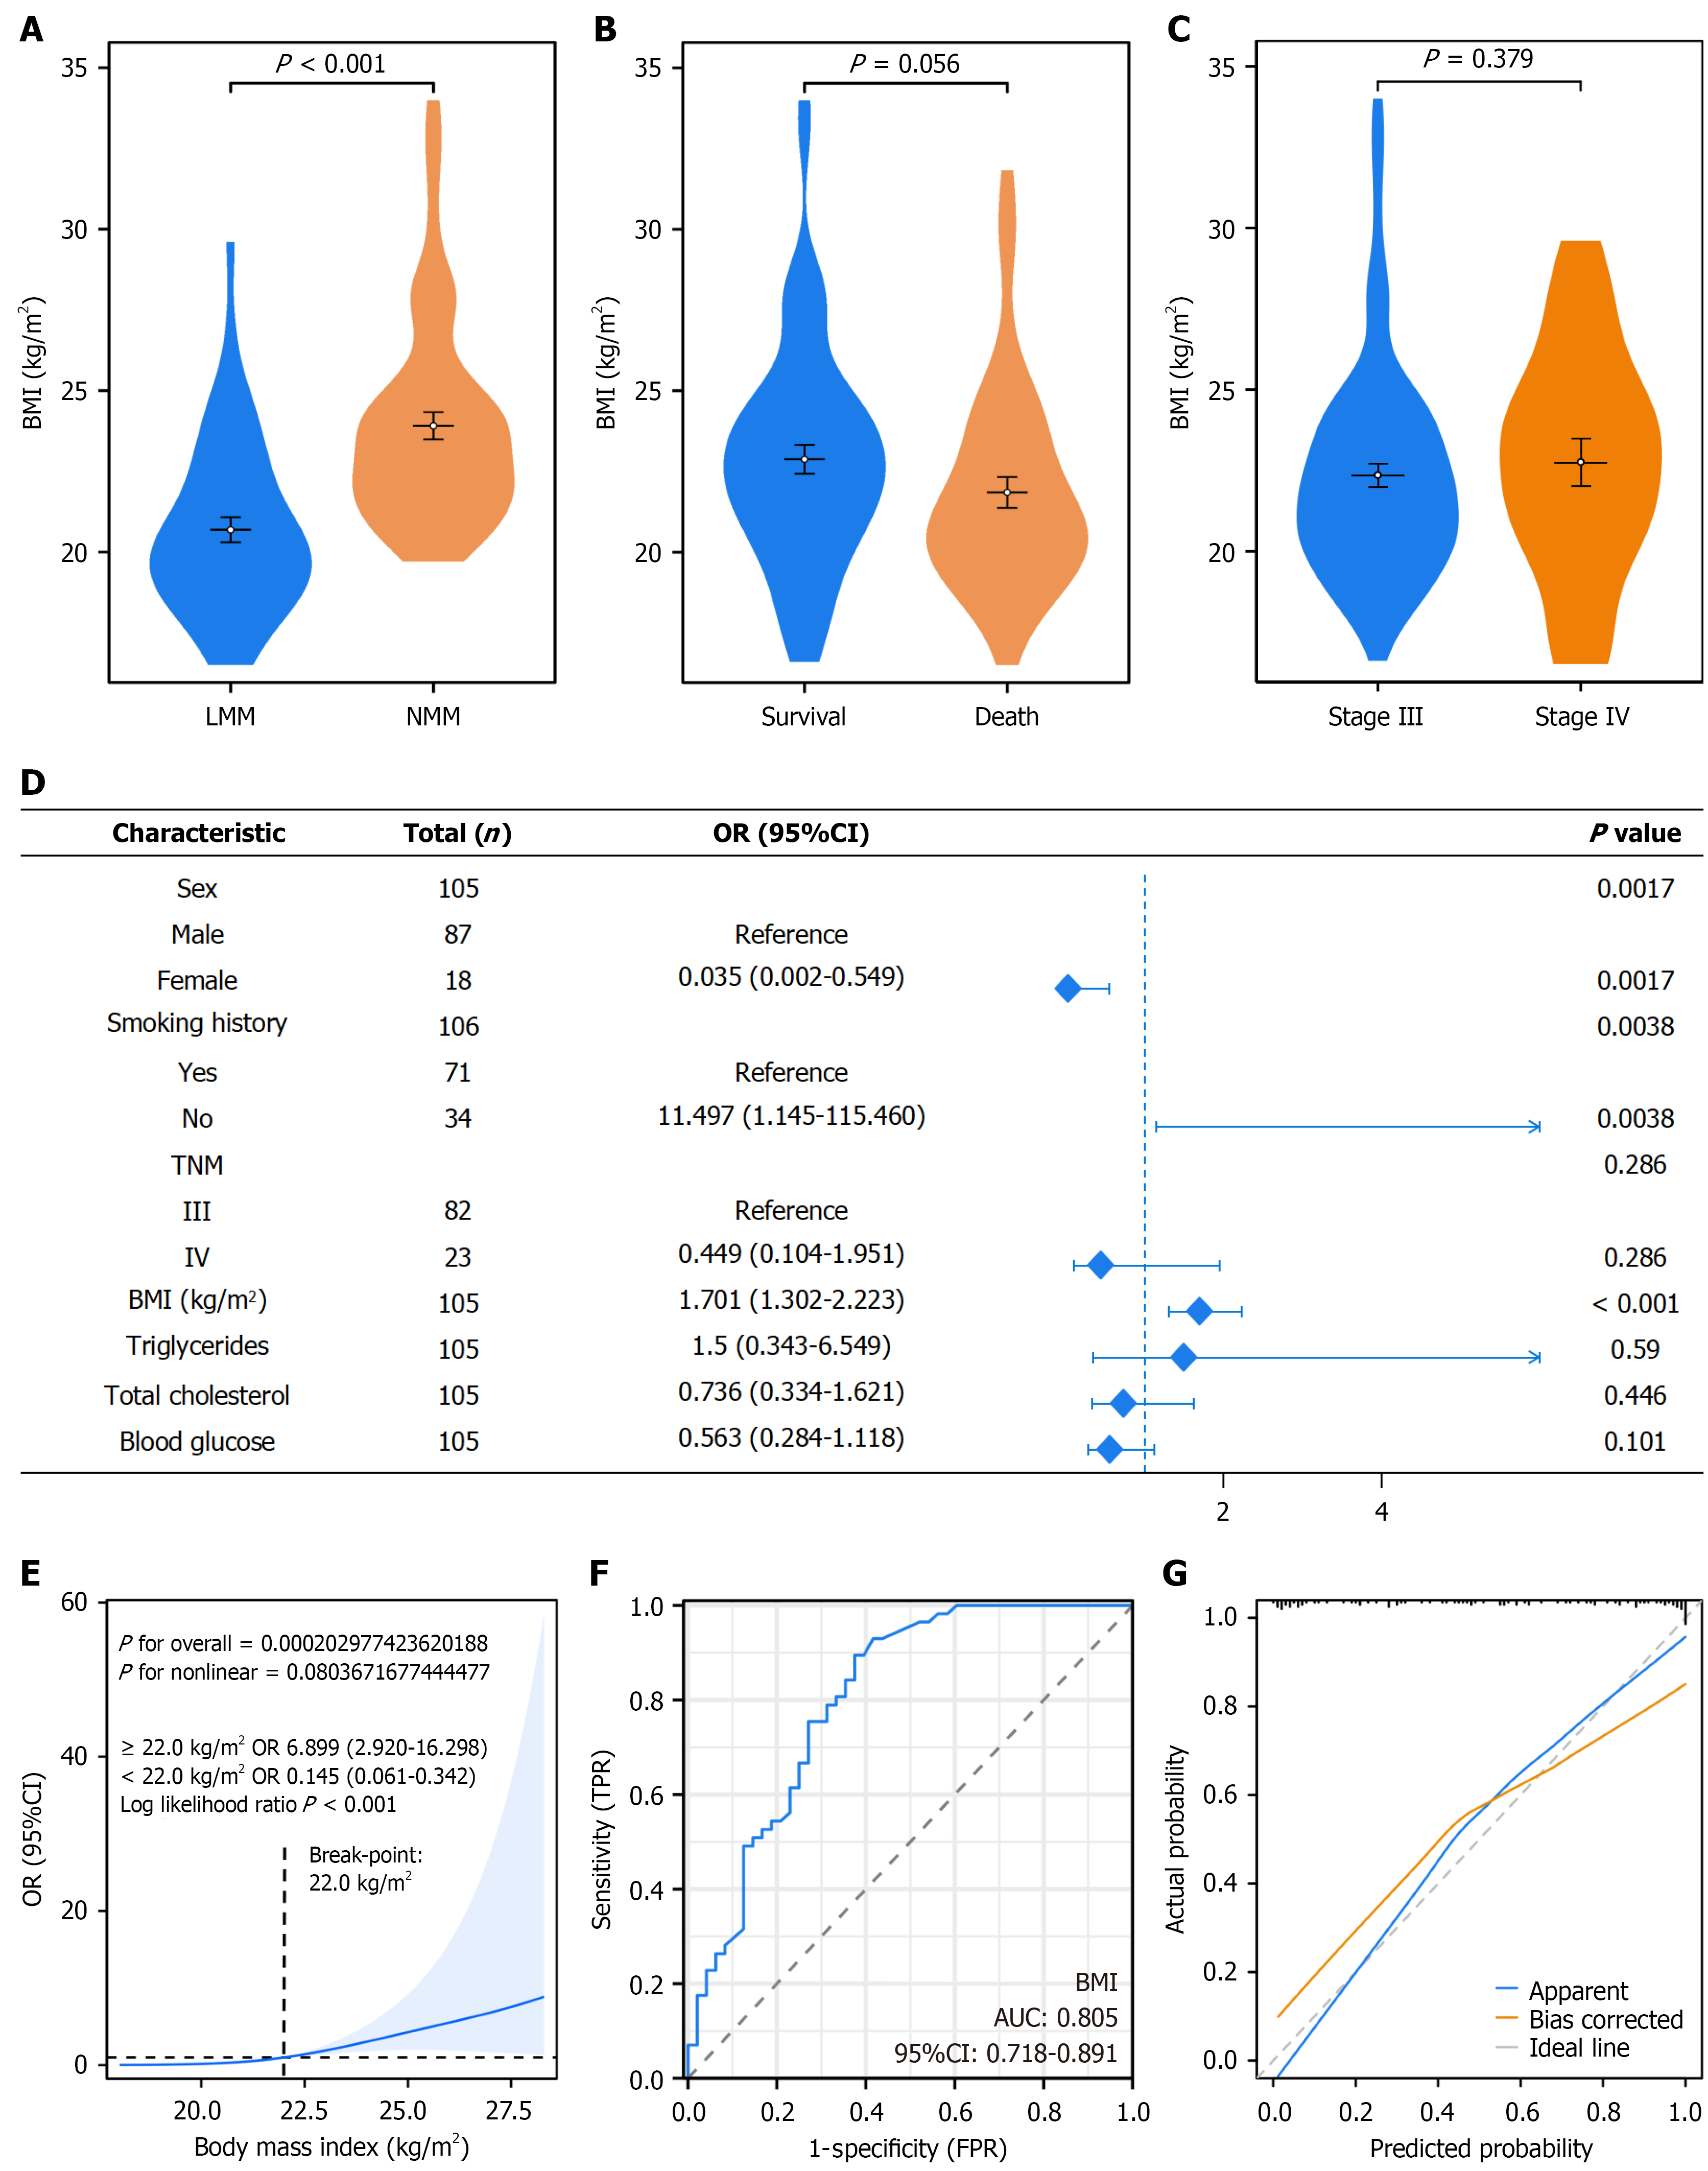
Figure 2 Low muscle mass and associated factors in esophageal cancer patients.
A-C: Present violin plots of body mass index (BMI) distribution across different clinical subgroups; D: A forest plot of multivariable logistic regression analysis for factors associated with low muscle mass (LMM); E: Depicts the nonlinear association between BMI and LMM using restricted cubic spline analysis; F and G: Display the receiver operating characteristic curve and calibration curve of the LMM prediction model, respectively. OR: Odds ratio; CI: Confidence interval; BMI: Body mass index; TNM: Tumor-node-metastasis; AUC: Area under the curve; FPR: False-positive rate; TPR: True-positive rate.
- Citation: Xiao L, Li LJ, Lyu JH, Zhang SC, Liang L. Combined low muscle mass and body mass index for prognosis in esophageal squamous cell carcinoma patients receiving immunochemoradiotherapy. World J Gastrointest Oncol 2026; 18(11): 123631
- URL: https://www.wjgnet.com/1948-5204/full/v18/i11/123631.htm
- DOI: https://dx.doi.org/10.4251/wjgo.123631