
















Copyright: ©Author(s) 2026.
World J Gastrointest Oncol. Nov 15, 2026; 18(11): 123558
Published online Nov 15, 2026. doi: 10.4251/wjgo.123558
Published online Nov 15, 2026. doi: 10.4251/wjgo.123558
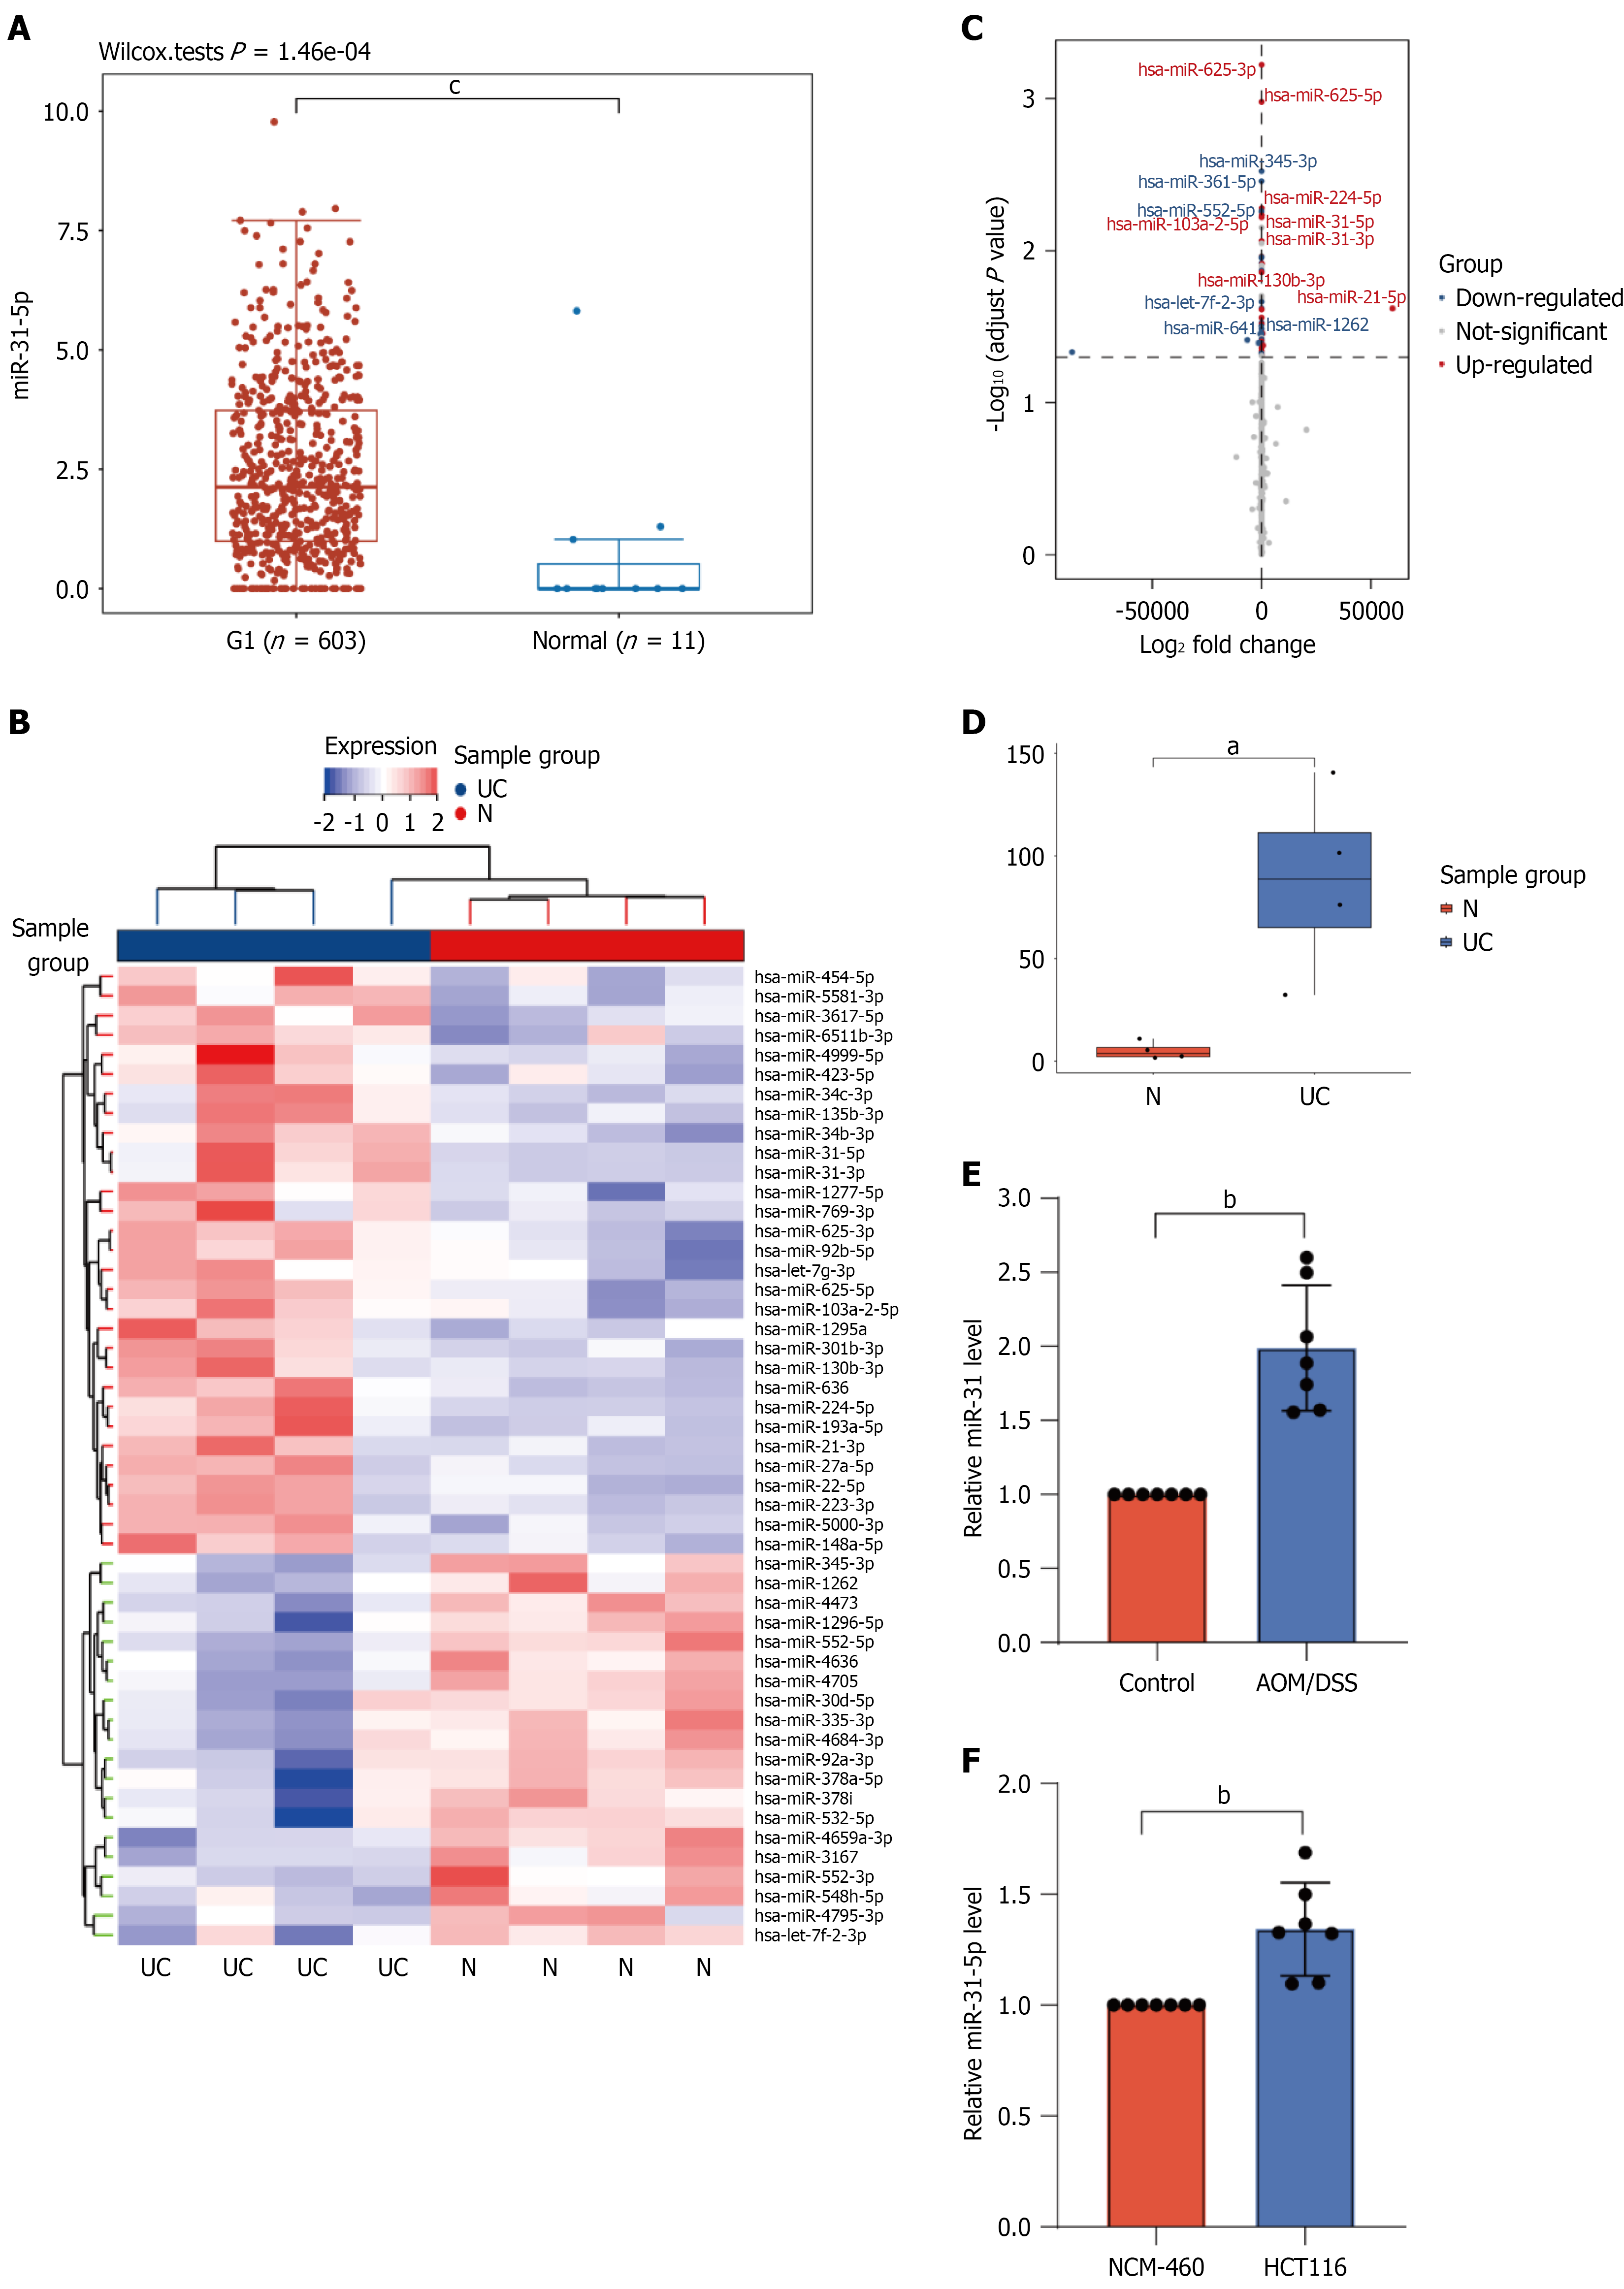
Figure 1 MiR-31-5p expression levels are elevated in human colorectal cancer, human ulcerative colitis, mouse colitis-associated colorectal cancer, and HCT116 colorectal cancer cells.
A: The Cancer Genome Atlas-derived box plot of miR-31-5p expression in colorectal cancer tissues vs normal controls. cP < 0.001 vs normal controls; B: Heatmap of differentially expressed microRNAs in a pilot human ulcerative colitis (UC) vs adjacent normal controls; C: Volcano plot of differentially expressed microRNAs in a pilot human UC vs adjacent normal controls; D: MiR-31-5p expression in paired inflamed and adjacent normal controls colonic tissues from pilot UC patients. aP < 0.05 vs adjacent normal controls (n = 4 pairs); E: Quantitative reverse transcription polymerase chain reaction quantification of colonic miR-31 in azoxymethane/dextran sulfate sodium-treated C57BL/6 mice. bP < 0.01 vs control (n = 7); F: Quantitative reverse transcription polymerase chain reaction quantification of miR-31-5p expression in NCM-460 cells and HCT116 cells. bP < 0.01 vs NCM-460 (n = 7). N: Normal controls; UC: Ulcerative colitis; AOM: Azoxymethane; DSS: Dextran sulfate sodium.
- Citation: Wu YL, Wang X, Du XX, Liu KL, Wang CF, Liu JC, Cao JM, Cui XL. Resveratrol suppresses ulcerative colitis and colitis-associated colorectal cancer via modulating the miR-31-5p/SATB2 axis. World J Gastrointest Oncol 2026; 18(11): 123558
- URL: https://www.wjgnet.com/1948-5204/full/v18/i11/123558.htm
- DOI: https://dx.doi.org/10.4251/wjgo.123558