
















Copyright: ©Author(s) 2026.
World J Gastrointest Oncol. Nov 15, 2026; 18(11): 123400
Published online Nov 15, 2026. doi: 10.4251/wjgo.123400
Published online Nov 15, 2026. doi: 10.4251/wjgo.123400
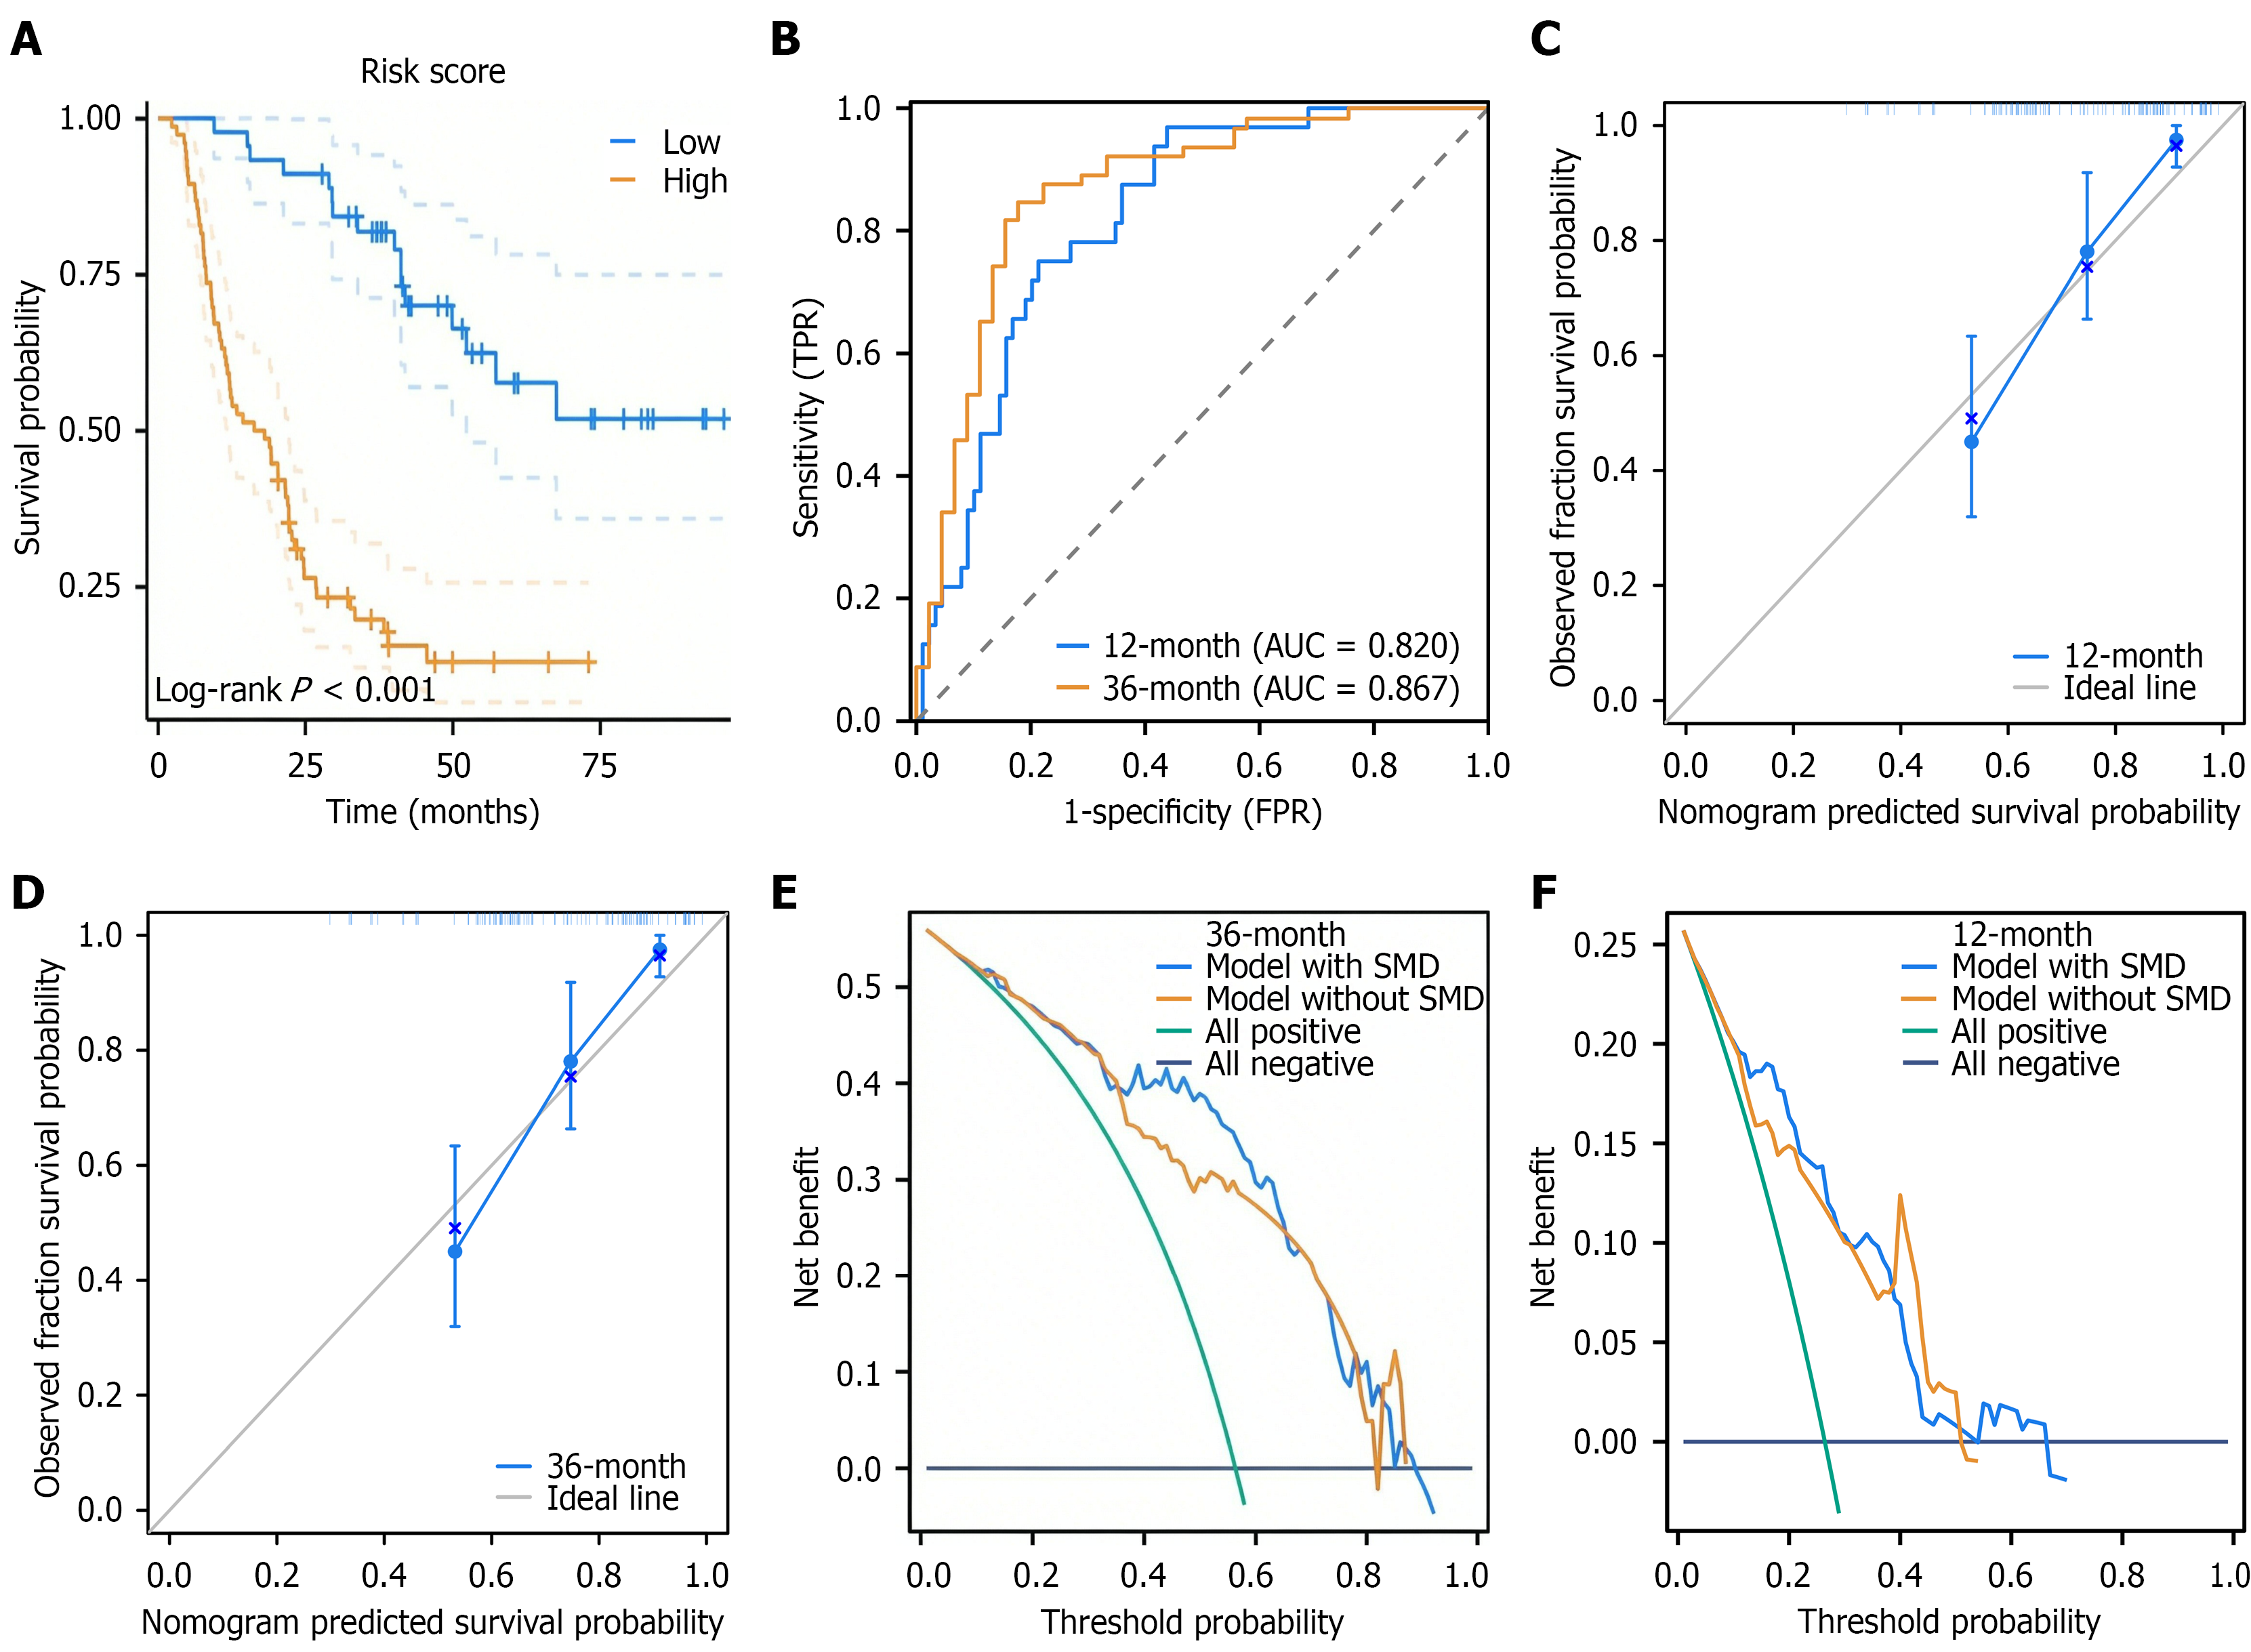
Figure 4 Prognostic model construction and validation based on post-treatment skeletal muscle density in patients aged < 64 years with esophageal squamous cell carcinoma.
A: Kaplan-Meier survival curves stratified by risk score; B: Time-dependent receiver operating characteristic curves of the model; C and D: Bootstrap-based calibration curves for 12-month and 36-month overall survival prediction; E and F: Calibration curves for 12- and 36-month survival prediction. FPR: False positive rate; TPR: True positive rate; AUC: Area under the curve; SMD: Skeletal muscle density.
- Citation: Xiao L, Yang YH, Zhang SC, Lyu JH. Prognostic impact of post-chemoradiotherapy muscle quality in non-elderly adults with esophageal squamous cell carcinoma. World J Gastrointest Oncol 2026; 18(11): 123400
- URL: https://www.wjgnet.com/1948-5204/full/v18/i11/123400.htm
- DOI: https://dx.doi.org/10.4251/wjgo.123400